**WTMS Blog Today = What’s up in Mortgage Today (AM) – 09/14/2026**
This morning’s market opened with a rally that has completely erased by the close, as UMBS securities fell sharply and the 10-year Treasury yield pushed toward 5 percent on renewed inflation concerns. MBS prices reflected heavy selling pressure with current coupons losing ground across all coupon levels, signaling investor anxiety ahead of Wednesday’s Federal Reserve decision. The rally that began the session fell victim to snowball selling momentum, a reminder that even intraday gains offer no guarantee of recovery in a bear market.
August’s CPI report hit expectations with core inflation rising 0.3 percent month over month—hotter than forecast—pushing CME FedWatch odds of a September 16 rate hike to 85.4 percent. Existing home sales fell 10.7 percent from July to August while inventory reached its highest level in years, yet falling prices still fail to attract buyers as borrowing costs climb relentlessly. The path to rate relief now depends entirely on inflation moderating, a scenario that remains firmly out of reach for homebuyers this quarter.
Mortgage servicers and foreclosure attorneys face AI litigation risk that extends far beyond the AI tools they directly control. A Washington D.C. appellate court struck Deutsche Bank’s foreclosure brief after its outside law firm cited four fictitious court cases generated by Google’s AI search tool, with the court referring the matter to disciplinary counsel.
This warning signals that compliance exposure flows through every external vendor and third-party counsel involved in loan servicing, title work, and legal defense—creating enterprise-wide accountability for AI failures originators never knew were happening. Nonbank lenders are rapidly capturing share in the home equity market, growing HELOC originations 140 percent between 2023 and 2025 compared to just 7 percent at large banks. American homeowners hold a record $34.9 trillion in residential real estate equity, with mortgage borrowers commanding $17.9 trillion of that, including roughly $11 trillion available to tap.
The competitive dynamics have shifted decisively: nonbanks now capture 29 percent of subordinate-lien originations, up from just 8 percent in 2022, forcing institutions to decide whether to compete or accept margin compression. Oil prices surged above $100 per barrel following Saudi Arabia’s closure of its East-West pipeline, reigniting energy-driven inflation concerns that complicate the Fed’s policy path this week. The 10-year Treasury yield rose 20 basis points over last week to 4.98 percent while the 2-year climbed 27 basis points to 4.64 percent, bearing-flattening the curve by 8 basis points.
Global equities tumbled as AI firms proposed slowing development, with tech stocks falling 5 percent and the Nasdaq 100 futures down 1.5 percent in early trading. Market consensus now prices a 25-basis-point Fed hike on Wednesday as fait accompli, with traders increasingly betting on a second increase before year-end. The key question this week shifts from whether the Fed hikes to what new “dot plot” projections imply about the path beyond September and whether energy inflation becomes a persistent economic headwind.
With housing starts, building permits, pending home sales, and leading indicators all reporting this week, originators should expect continued volatility as the market reprices expectations for both monetary policy and economic growth.
**Locking vs Floating**
Today reinforced the power of prevailing market momentum once again. When bonds enter snowball selling mode, even morning rallies offer no lasting protection—a defensive locking strategy remains the only reliable stance.
Heavy selling does introduce occasional bounce opportunities, but these are notoriously difficult to time and carry no guarantee of becoming sustained turning points.
**Bond Pricing**
**UMBS 30 yr**
| Coupon | Price | Intra-Day Change |
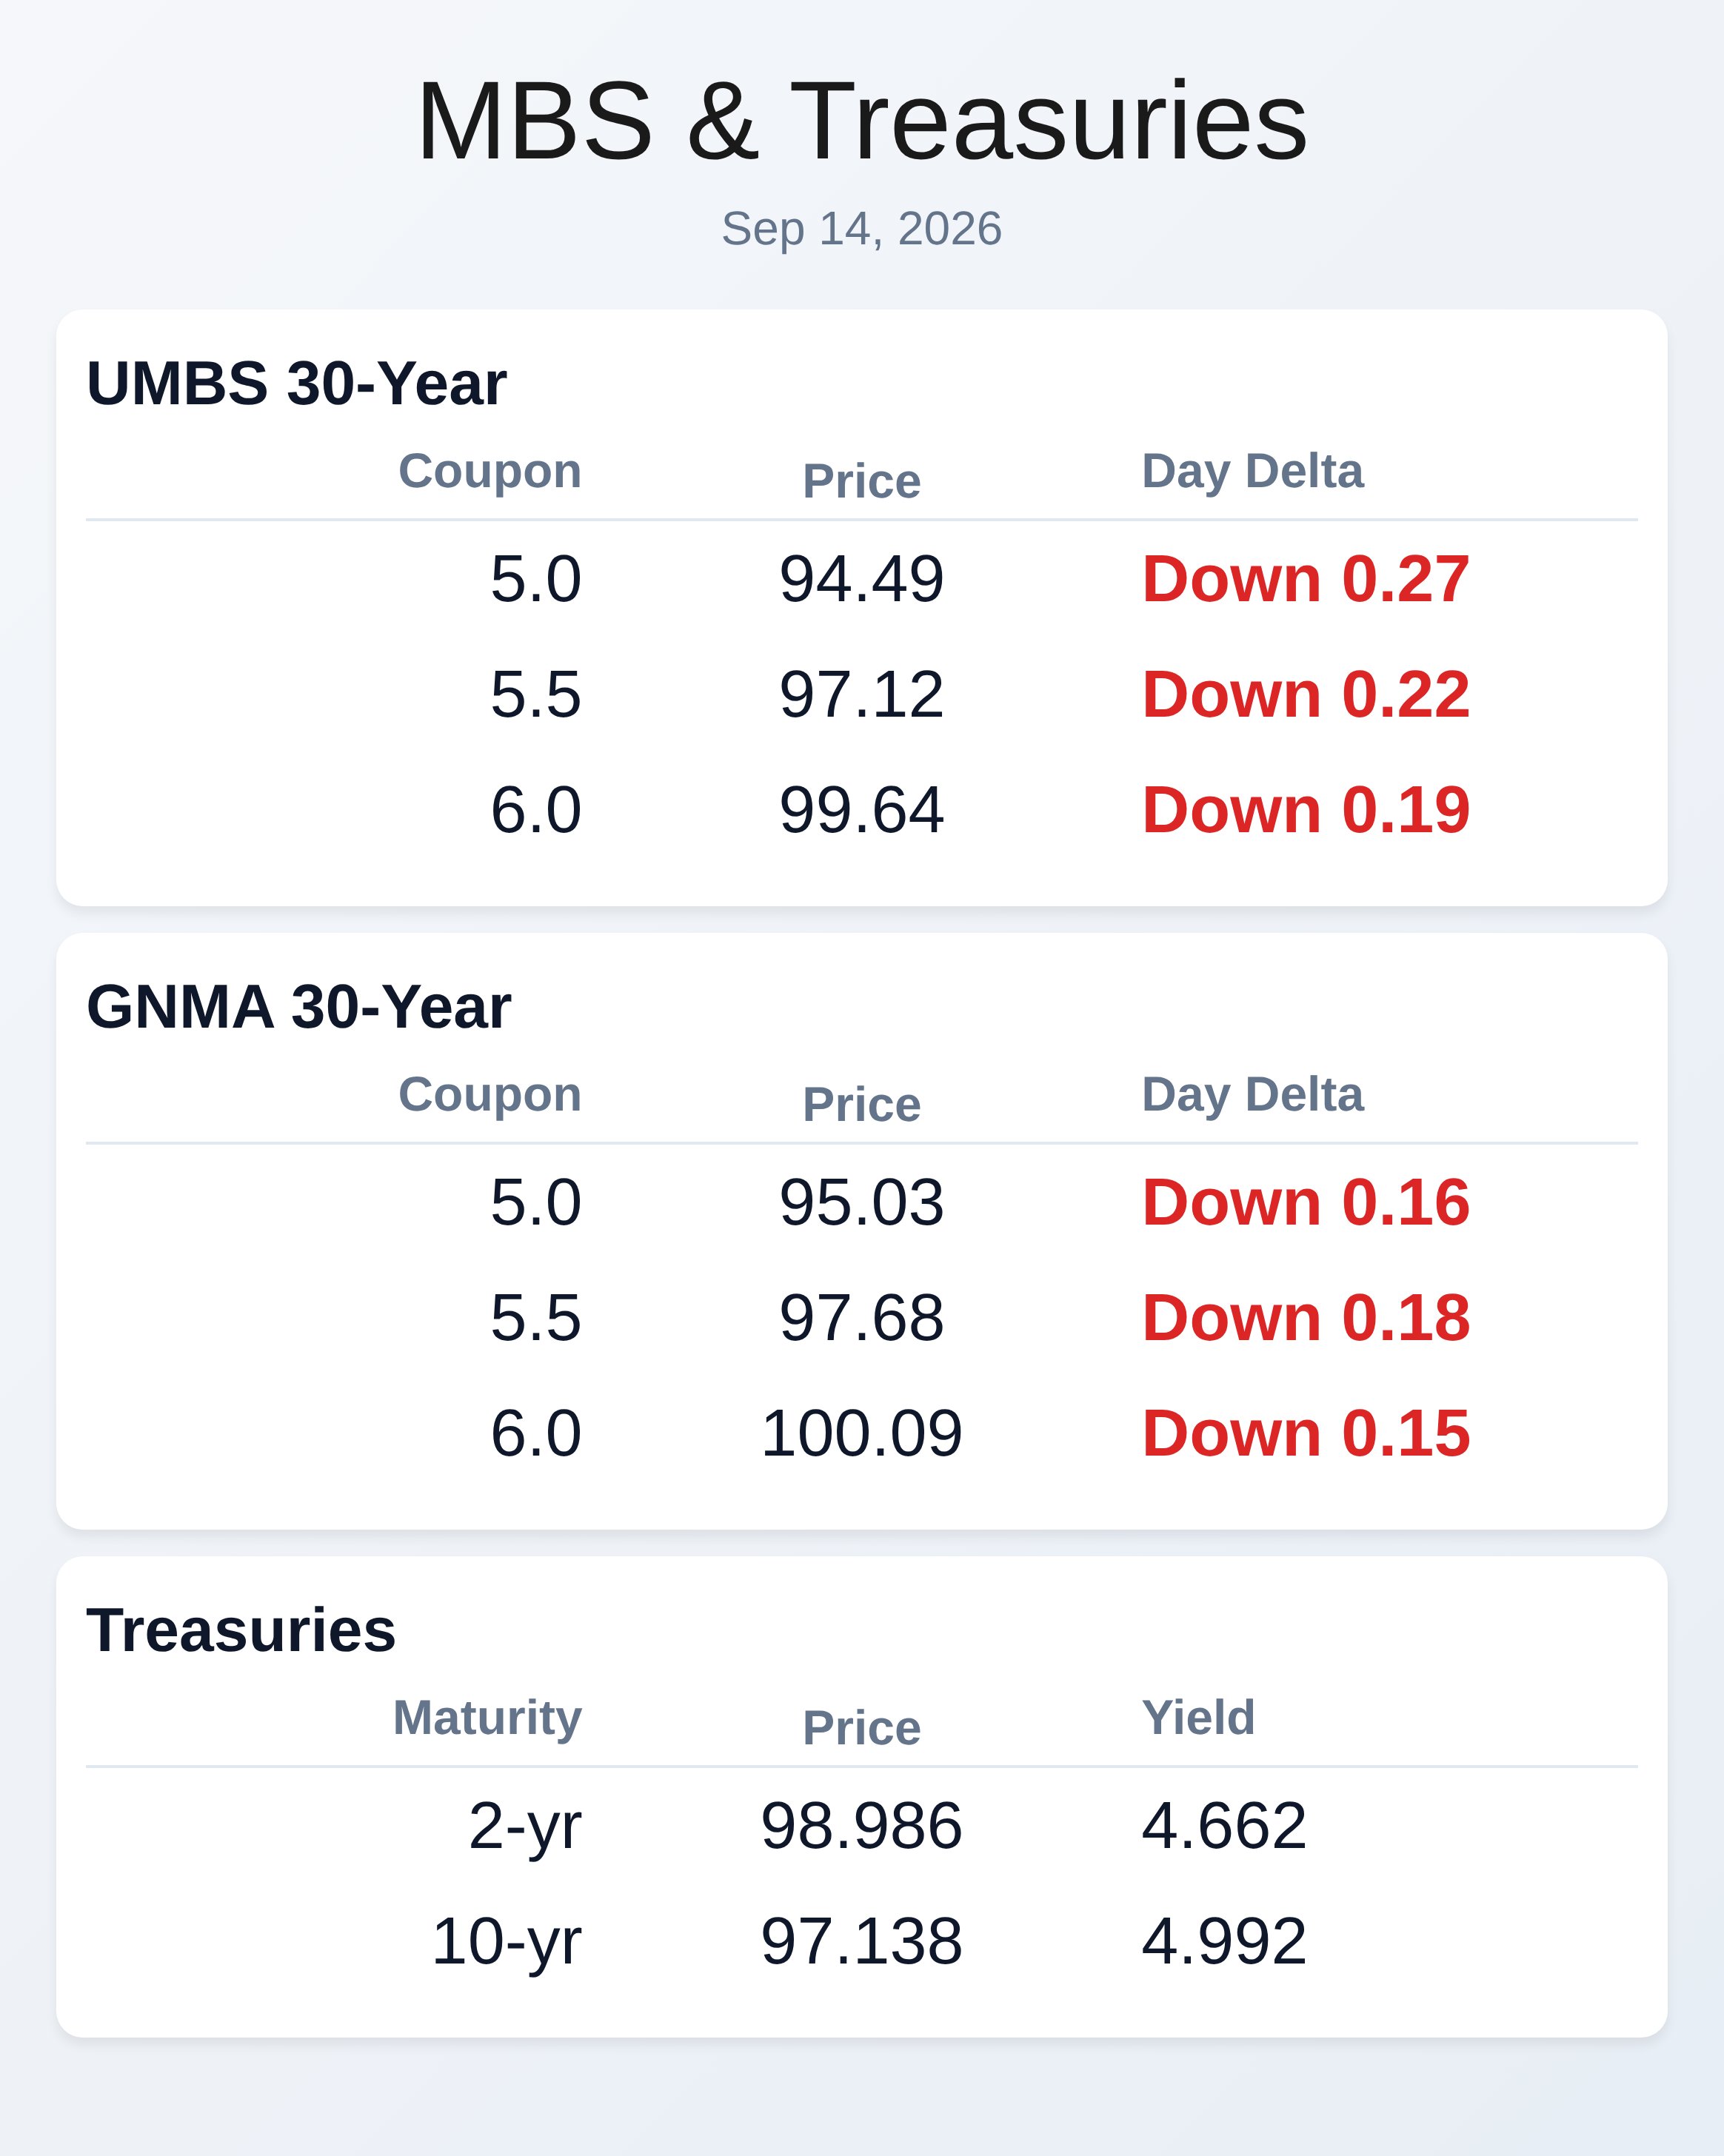
| 5.0 | 94.49 | -0.27 |
| 5.5 | 97.12 | -0.22 |
| 6.0 | 99.64 | -0.19 |
**GNMA 30 yr**
| Coupon | Price | Intra-Day Change |
**Treasuries**
| Term | Yield | Price | Intra-Day Yield Change |
**GNMA 30 yr**
| Coupon | Price | Intra-Day Change |
|—:|—:|—:|
| 5.0 | 95.03 | -0.16 |
| 5.5 | 97.68 | -0.18 |
| 6.0 | 100.09 | -0.15 |
**Treasuries**
| Term | Yield | Price | Intra-Day Yield Change |
|—|—:|—:|—:|
| 2 yr | 4.662 | 98.986 | 0.043 |
| 3 yr | 4.756 | 98.945 | 0.036 |
| 5 yr | 4.822 | 98.036 | 0.037 |
| 7 yr | 4.901 | 97.647 | 0.04 |
| 10 yr | 4.992 | 97.138 | 0.023 |
| 30 yr | 5.364 | 96.453 | 0.009 |
Stay ahead of market shifts—subscribe free to WTMS Blog at WellThatMakesSense.com.