**WTMS Blog Today = What’s up in Mortgage Today (AM) – 09/17/2026**
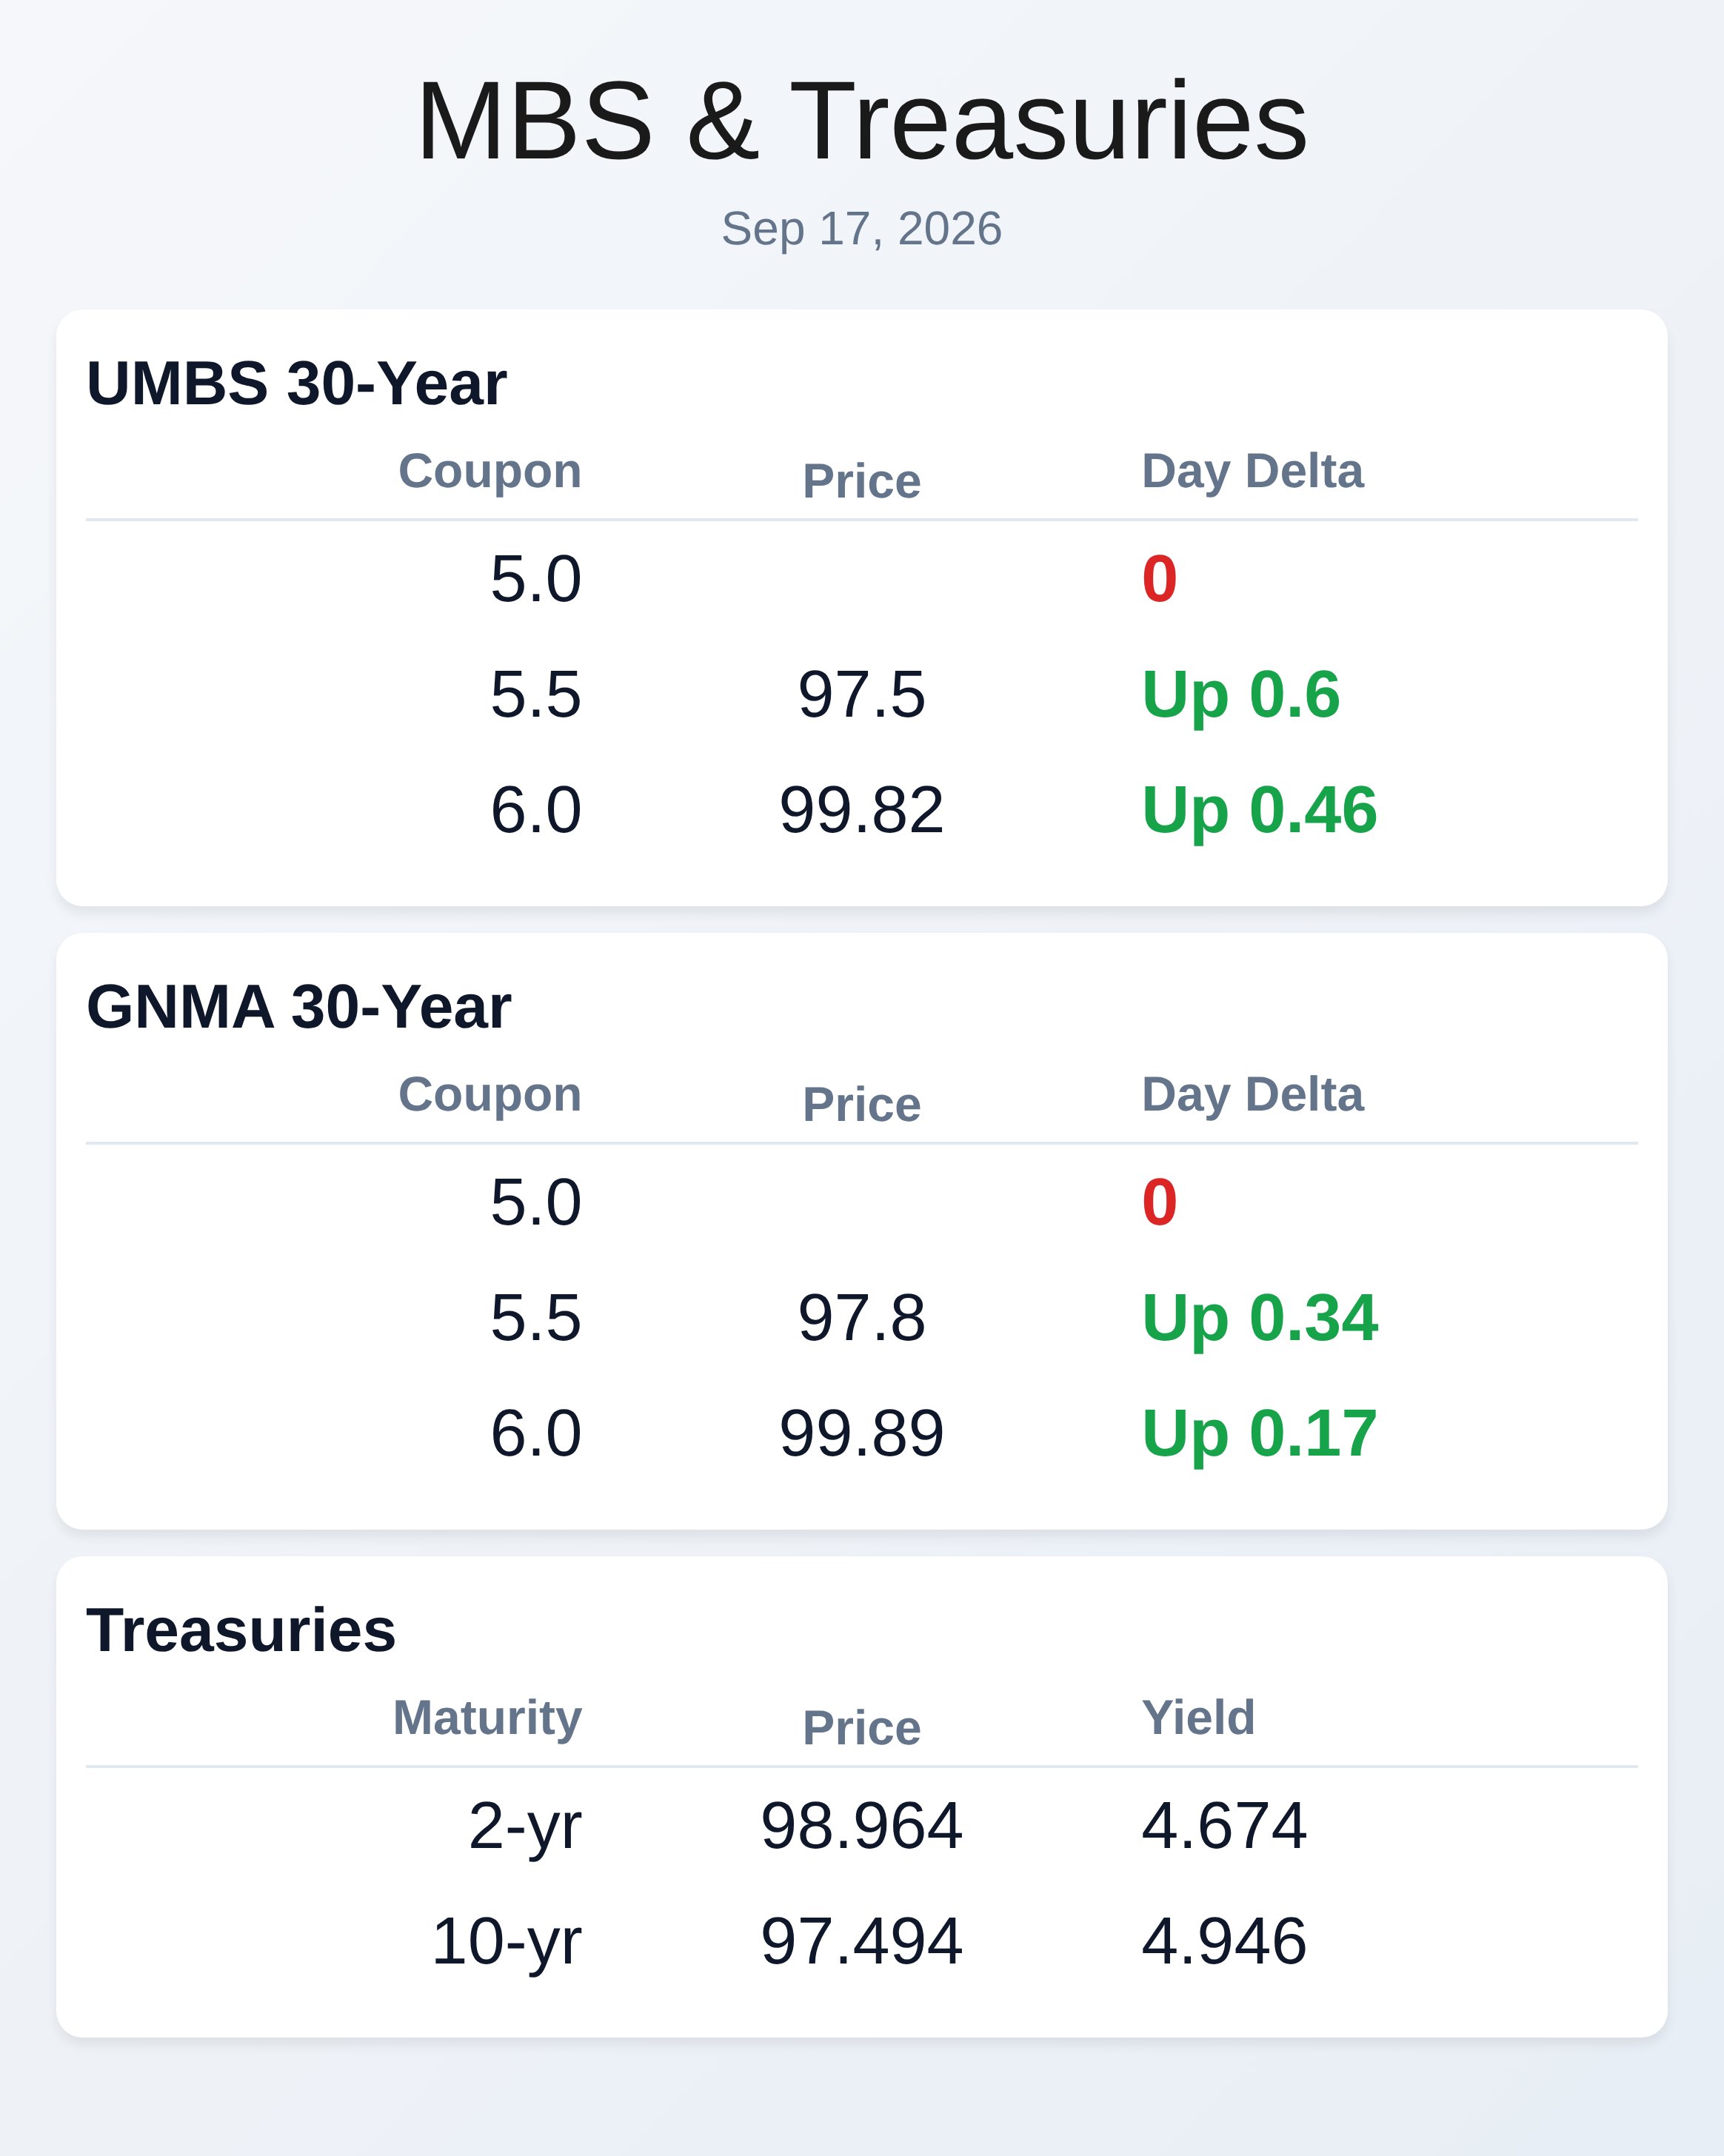
The Federal Reserve’s quarter-point rate hike to 4.00 percent sent mixed signals through bond markets yesterday, with Treasury yields rallying back this morning even as policymakers signaled more tightening ahead. Agency MBS prices rebounded modestly overnight, with UMBS 6.0s holding at 99.82, suggesting some stabilization after the initial volatility. The hawkish tone from Fed policymakers—16 of 18 officials now see at least one more hike in 2026—continues to create uncertainty for lenders trying to lock or float rate locks.
Jobless claims came in stronger than expected at 196,000 versus forecasts of 207,000, adding to the mixed economic picture. The 10-year Treasury yield opened this morning at 4.97 percent, down nearly 5 basis points from yesterday’s close at 5.01 percent. The week’s economic data painted a picture of an economy resilient on employment but fragile on housing.
August housing starts fell short at 1.275 million versus expectations of 1.31 million, marking continued weakness in new construction. Building permits also disappointed at 1.394 million, though continuing claims declined to 1.730 million from 1.774 million the prior week. The Philly Fed Business Index dropped to 37.8 from 47.4, signaling a noticeable pullback in regional manufacturing sentiment.
These crosscurrents leave originators navigating an environment where robust labor markets contrast sharply with deteriorating housing demand. GNMA 30-year securities showed less volatility than UMBS in overnight trading, with the 6.0 coupon priced at 99.89 after gaining just 17 basis points intraday. The 6.5 coupon held at 102.03, suggesting investors are rotating into higher coupons as rate expectations stabilize.
GNMA’s more stable performance reflects the government guarantee and continued demand from portfolio managers seeking yield in a higher-for-longer rate environment. Treasury curve positioning shows the 2-year yielding 4.67 percent and the 30-year at 5.30 percent, indicating markets are pricing in eventual rate cuts but not expecting them anytime soon. The spread dynamics between shorter and longer maturities remain the key lens for tracking duration bets across fixed-income desks.
Originators face a critical decision point as secondary desks have already repriced locks following the Fed’s move. Some lenders held back repricing yesterday afternoon, likely setting themselves up for adjustments this morning, which increases float risk for brokers still holding paper. The consensus among trading desks is cautious: higher Fed funds rates should ultimately help mortgage rates by fighting inflation, but the near-term noise from Fed decisions makes it impossible to confirm that benefit immediately.
Floating on lenders who haven’t repriced introduces execution risk, while those who repriced for the worse still leave room for tactical positioning before a clear trend emerges. The defensive strategy of waiting for momentum confirmation remains the prudent choice given the elevated uncertainty in rate direction. Mortgage application data from the Mortgage Bankers Association revealed that builder applications for new home purchases fell 5.5 percent year-over-year and declined 6 percent month-over-month in August.
This marks the fifth consecutive month of declining applications and represents 2026’s lowest monthly total for new construction purchases. Retail sales proved stronger than anticipated at 1.2 percent month-over-month, with core sales up 1.4 percent, showing consumers remain willing to spend even at elevated borrowing costs. The tension between consumer spending power and housing affordability continues to define market dynamics as mortgage rates remain elevated despite yesterday’s Treasury rally.
The Fed’s updated projections now show a median year-end fed funds rate of 4.125 percent, implying one to two additional rate moves before year-end depending on inflation data. Treasury yields have stabilized this morning after moving lower on expectations that the aggressive tightening cycle may finally be plateauing, though any signs of sticky inflation could trigger another leg higher. Oil prices fell 2.5 percent overnight to $99.90 per barrel, easing some of the near-term inflation concerns that had pushed yields to multi-decade highs.
The combination of cooling commodity prices, resilient labor markets, and weaker housing activity creates a complex backdrop where mortgage originators must balance rate lock strategy with pipeline management. Markets will closely watch the October and December Fed meetings and any revisions to the neutral rate before committing to a clear directional view on 2027 rates.
**Locking vs Floating**
Yesterday’s Fed hike created an extremely difficult environment for lock-versus-float decisions.
Several lenders did not reprice yesterday afternoon, meaning brokers holding loans with those lenders face repricing risk this morning when the lender adjusts. Floating strategy works best when lenders who repriced for worse leave room for positive adjustments, but even then the prudent approach is to wait for clear momentum before abandoning defensive positioning. Treasury support has returned near yesterday’s levels, confirming some stability, but the bigger picture question remains unanswered: will higher Fed funds rates ultimately help or hurt mortgage rates?
The safest path is to hold defensive floats while monitoring for a strong directional shift rather than trying to catch tops or bottoms during Fed weeks.
**Today’s Events**
Building Permits (Aug): 1.394M vs 1.41M forecast, 1.433M prior
Continued Claims (Sep/05): 1.730M vs 1.780K forecast, 1.774K prior
Housing Starts (Aug): 1.275M vs 1.31M forecast, 1.239M prior
Jobless Claims (Sep/12): 196K vs 208K forecast, 206K prior
Philly Fed Business Index (Sep): 37.8 vs 30.5 forecast, 47.4 prior
Philly Fed Prices Paid (Sep): 48.60 vs no forecast, 40.90 prior
**Bond Pricing**
**UMBS 30 yr**
| Coupon | Price | Intra-Day Change |
| 5.5 | 97.5 | 0.6 |
| 6.0 | 99.82 | 0.46 |
| 5.5 | 97.8 | 0.34 |
**GNMA 30 yr**
| Coupon | Price | Intra-Day Change |
**Treasuries**
| Term | Yield | Price | Intra-Day Yield Change |
| 2 yr | 4.674 | 98.964 | -0.06 |
| 3 yr | 4.745 | 98.976 | -0.08 |
| 5 yr | 4.791 | 98.17 | -0.089 |
| 7 yr | 4.863 | 97.869 | -0.088 |
| 10 yr | 4.946 | 97.494 | -0.073 |
| 30 yr | 5.304 | 97.323 | -0.059 |