WTMS Blog Today = What’s up in Mortgage Today (AM) – 10/20/2025
Mortgage bonds started the week with modest gains after an 8:20 AM rally lifted prices above Friday’s close. The 30-year UMBS 5.0 coupon gained 11 basis points overnight, reaching 99.87. This morning’s strength comes despite a complete absence of economic data releases.
The federal government shutdown continues to disrupt normal market patterns as critical economic reports remain delayed. Even the Conference Board’s Leading Index, typically published by a private organization, was postponed citing shutdown impacts. Markets are operating in a data vacuum that could persist for weeks.
Ten-year Treasury yields dropped 15 basis points to 3.994%, approaching the psychologically important 4.00% threshold. When the benchmark yield moves this dramatically, mortgage rates usually follow within 24-48 hours. The yield curve steepening suggests bond traders are positioning for potential Fed dovishness.
Agency MBS performance diverged slightly with GNMA securities lagging their UMBS counterparts. AGNC Investment Corp launched new performance indices for agency mortgage-backed securities, potentially improving market transparency. These benchmark tools could help mortgage originators better track their pipeline hedging effectiveness.
Locking vs Floating
Risk-averse clients should remain locked as rates flirt with longer-term lows without major economic catalysts ahead. Risk-tolerant borrowers can continue floating given the absence of significant corrections and favorable overnight trends. Remember that favorable trends can reverse quickly without warning, especially during data-light periods.
Today’s Events
No major economic data releases scheduled due to government shutdown
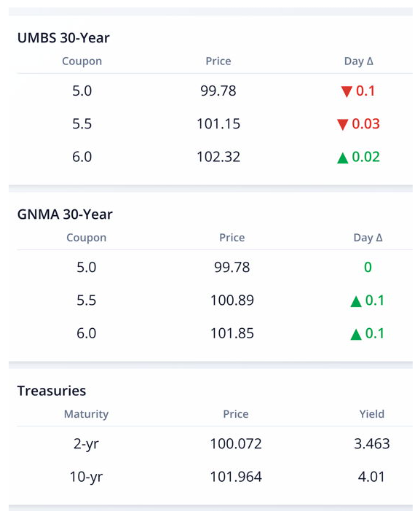
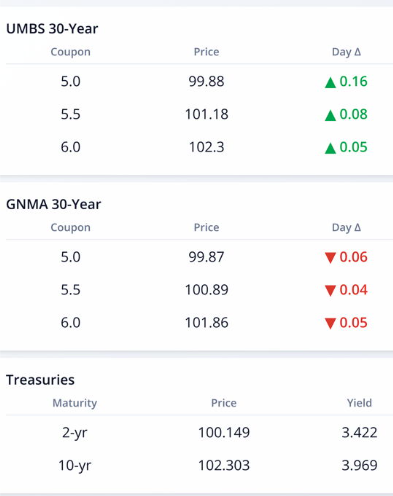
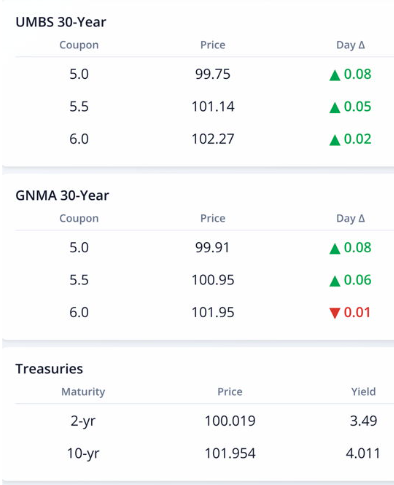
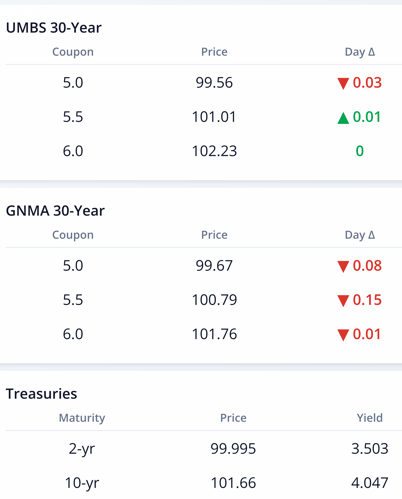
Bond Pricing
UMBS 30 yr
| Coupon | Price | Intra-Day Change |
| 5.0 | 99.87 | 0.09 |
| 5.5 | 101.22 | 0.07 |
| 6.0 | 102.33 | 0.01 |
GNMA 30 yr
| Coupon | Price | Intra-Day Change |
| 5.0 | 99.83 | 0.05 |
| 5.5 | 100.9 | 0.01 |
| 6.0 | 101.82 | -0.03 |
Treasuries
| Term | Yield | Price | Intra-Day Yield Change |
| 2 yr | 3.466 | 100.066 | 0.004 |
| 3 yr | 3.472 | 100.079 | 0.003 |
| 5 yr | 3.587 | 100.172 | -0.006 |
| 7 yr | 3.773 | 100.624 | -0.011 |
| 10 yr | 3.994 | 102.09 | -0.015 |
| 30 yr | 4.582 | 102.733 | -0.024 |