WTMS Blog Today = What’s up in Mortgage Today (AM) – 03/17/2026
Oil prices are driving today’s bond market rally as crude hovers near $100 per barrel amid ongoing Iran tensions. Treasury yields dropped across the curve with the 10-year falling to 4.21%, down from yesterday’s close of 4.22%. MBS prices gained strength overnight, with UMBS 5.0 coupon up 9 basis points after initially opening weaker.
The correlation between oil and bonds remains remarkably straightforward today. Geopolitical risk tied to Iran continues as the dominant macro driver, overshadowing economic data entirely. While some tankers are navigating the Strait of Hormuz and the U.S.
is working with allies to safeguard shipping lanes, investors remain defensive. This uncertainty is providing unexpected support for mortgage-backed securities. Economic data painted a weaker picture this morning with NY Fed manufacturing at -0.2 versus the 3.2 forecast and 7.1 prior reading.
Manufacturing sentiment weakened sharply while services business activity in the NY Fed district improved slightly to -22.6 from -25.7 last month. These softer numbers aren’t moving markets much as traders focus squarely on energy prices and inflation concerns. Housing builder confidence improved modestly according to the NAHB Housing Market Index, but affordability remains severely constrained with over a third of builders cutting prices.
The Federal Reserve begins its two-day FOMC meeting today, though expectations are for a non-event. Policymakers are expected to maintain their cautious wait-and-see stance as they assess whether the oil-driven inflation scare could morph into a broader growth concern. Chair Powell’s statement and press conference tomorrow afternoon will be closely watched.
The NAR’s pending home sales index for February is expected at -0.5% month-over-month, but won’t significantly impact rate movements. Mortgage-backed securities are navigating choppy waters with 30-year Ginnie Mae pools underperforming in this volatile environment. Shorter-duration Fannie Mae 15 and 20-year securities are holding up better as investors favor capital preservation strategies.
The 2s/10s Treasury spread remains near recent extremes at around 55 basis points while volatility has surged since the Middle East escalation. Housing affordability has reached historically challenging levels as high prices, elevated mortgage rates, and rising living costs continue pricing out average buyers. The Trump administration is reportedly pushing measures to expand mortgage credit through community banks and reduce regulatory barriers to housing development.
These efforts aim to boost supply and credit availability, though follow-through remains uncertain. For mortgage originators, the immediate concern is managing client expectations in this environment where geopolitical events can shift pricing rapidly within a single day.
Locking vs Floating
Volatility risk remains significantly elevated due to ongoing geopolitical uncertainty with Iran.
March has been entirely bearish for rates so far, making a defensive posture prudent for deals closing within the next 30 days. It will take more than two positive days to verify that the bearish trend has truly leveled off, as false hope emerged briefly on March 6th and 9th before reversing. Monitor oil prices closely as they continue driving bond market direction.
Today’s Events
– NY Fed Manufacturing: -0.2 vs 3.2 forecast, 7.1 previous
– NAR Pending Home Sales Index (February): Expected -0.5% month-over-month
– Treasury auction: $13 billion reopened 20-year bonds
– FOMC meeting begins (statement and Powell press conference tomorrow)
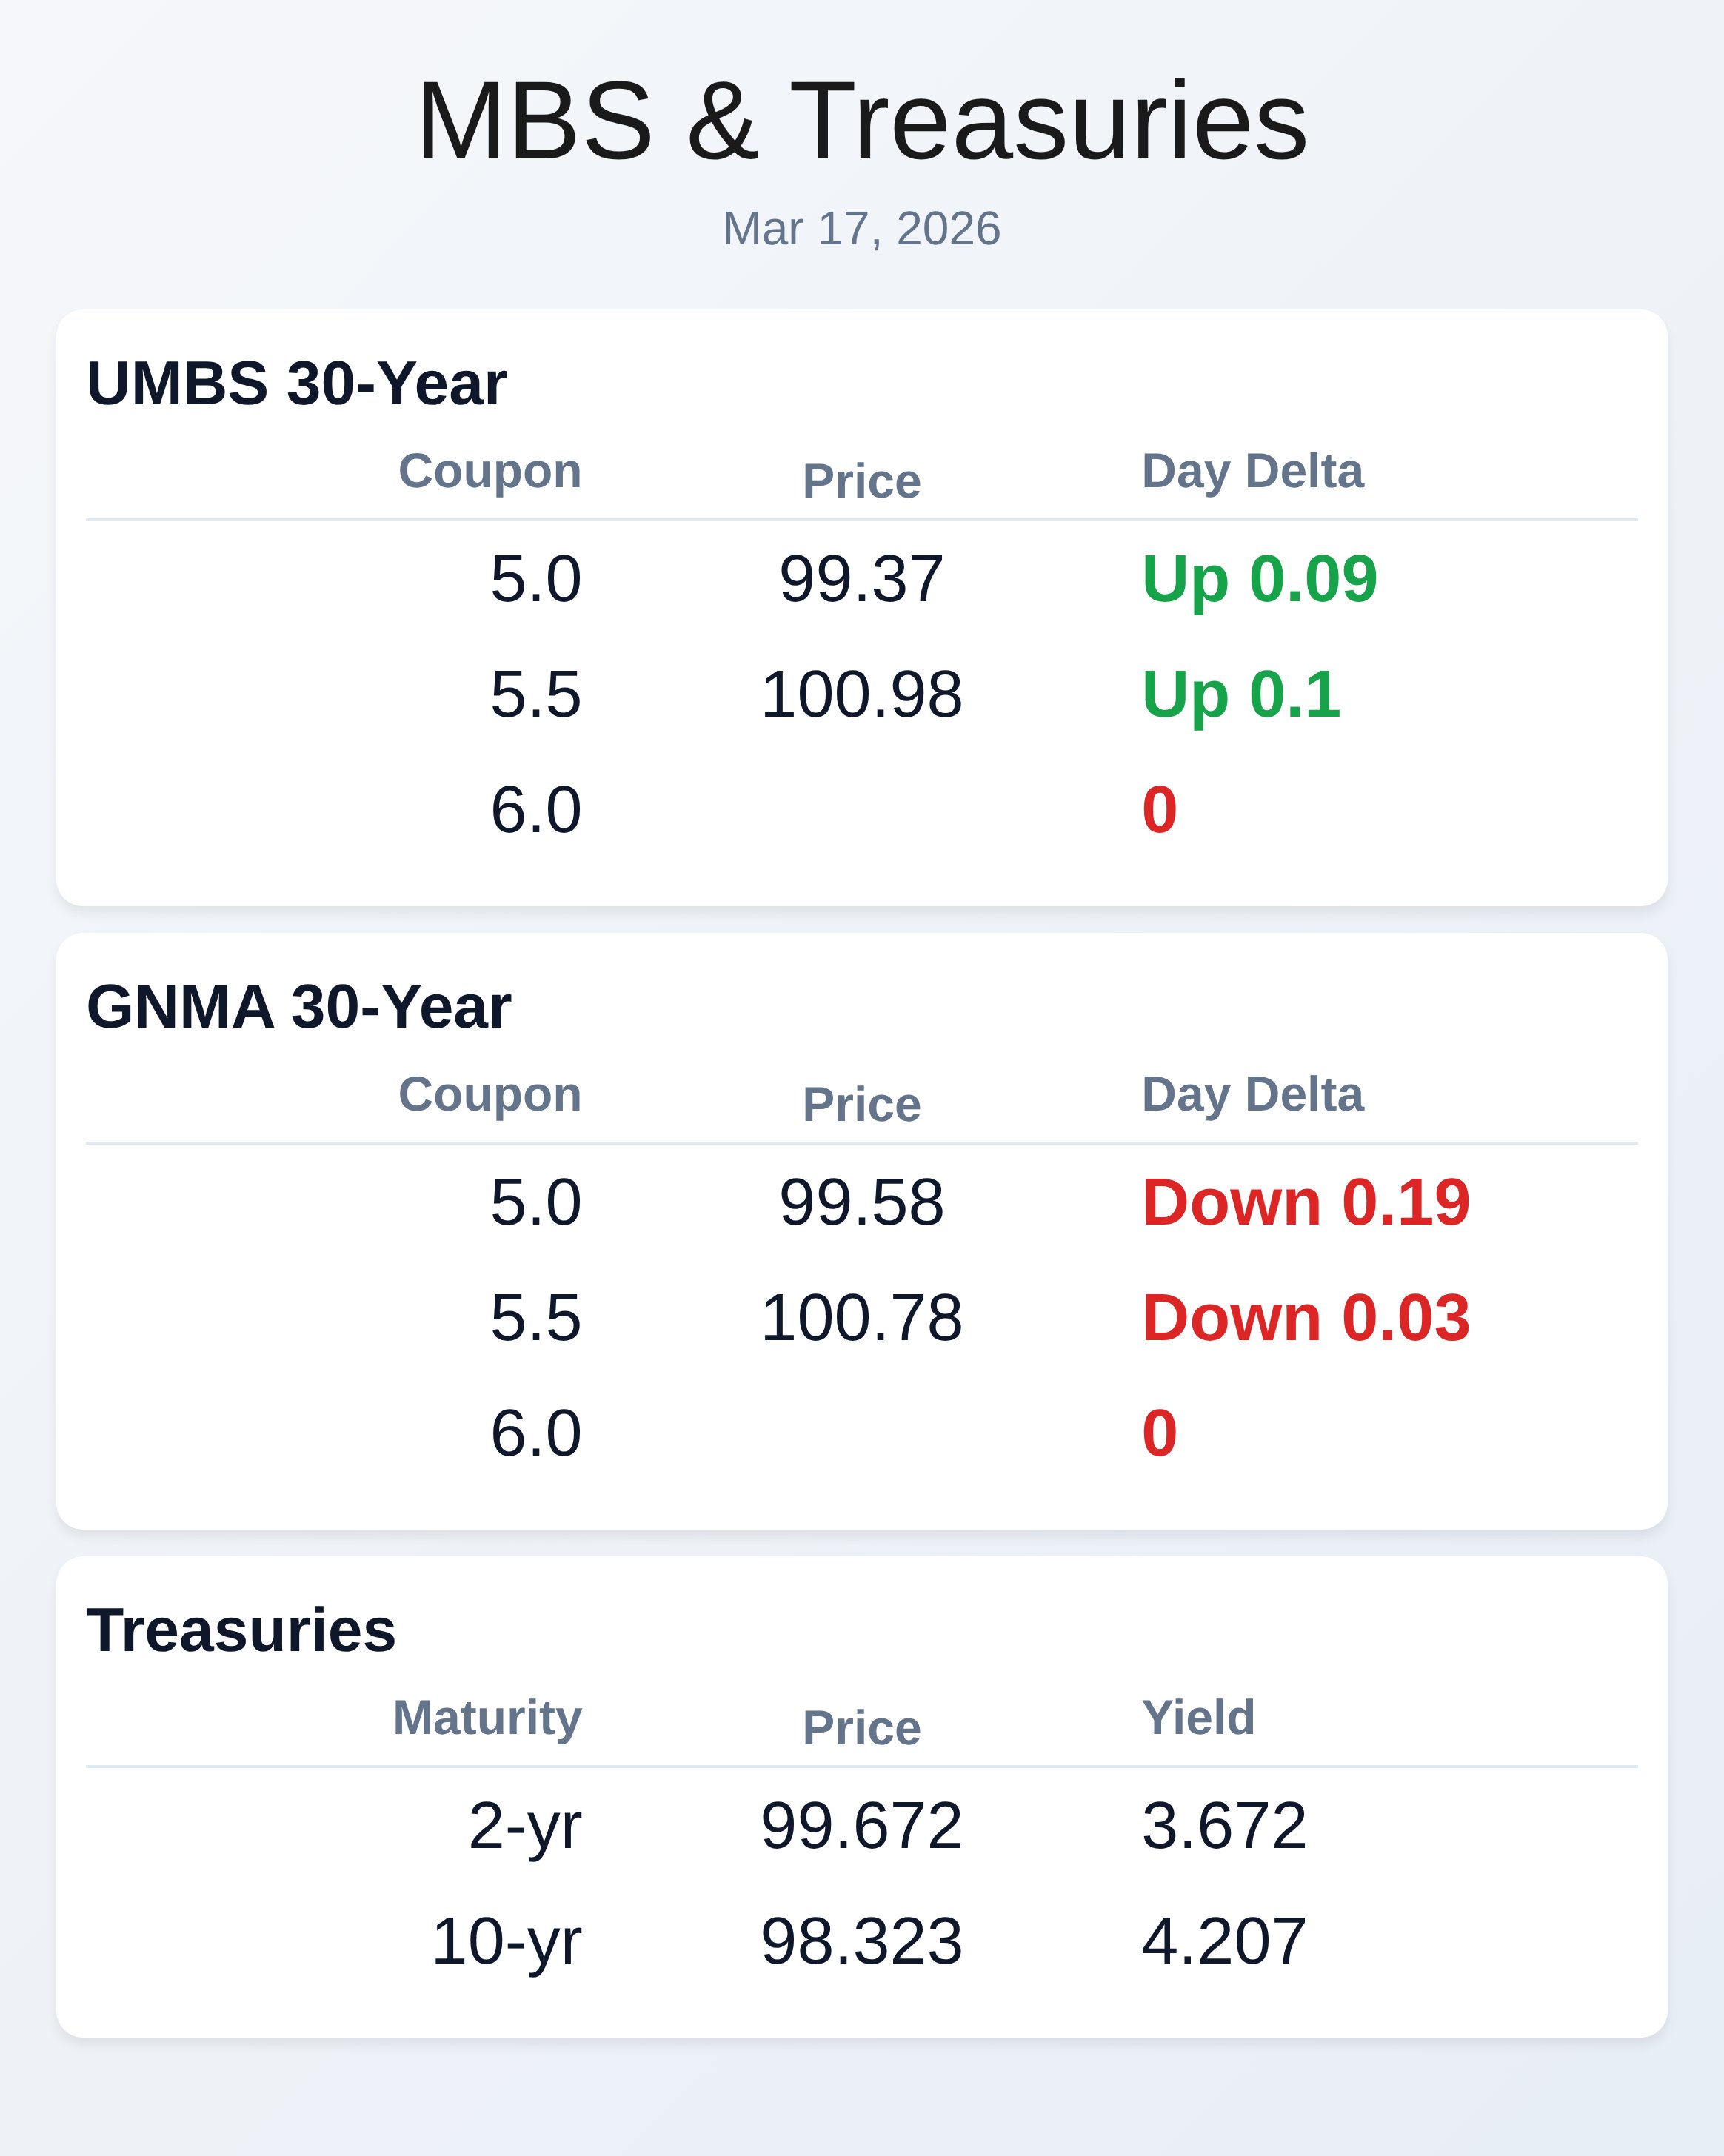
Bond Pricing
UMBS 30 yr
| Coupon | Price | Intra-Day Change |
GNMA 30 yr
| Coupon | Price | Intra-Day Change |
Treasuries
| Term | Yield | Price | Intra-Day Yield Change |
UMBS 30 yr
| Coupon | Price | Intra-Day Change |
| 4.5 | 97.37 | 0.12 |
| 5.0 | 99.37 | 0.09 |
| 5.5 | 100.98 | 0.1 |
GNMA 30 yr
| Coupon | Price | Intra-Day Change |
| 4.5 | 97.35 | 0.03 |
| 5.0 | 99.58 | -0.19 |
| 5.5 | 100.78 | -0.03 |
Treasuries
| Term | Yield | Price | Intra-Day Yield Change |
| 2 yr | 3.672 | 99.672 | -0.006 |
| 3 yr | 3.674 | 99.511 | -0.008 |
| 5 yr | 3.786 | 99.84 | -0.014 |
| 7 yr | 3.983 | 100.105 | -0.01 |
| 10 yr | 4.207 | 98.323 | -0.013 |
| 30 yr | 4.856 | 96.366 | -0.011 |
Subscribe free at WellThatMakesSense.com to get this in your inbox daily.