WTMS Blog Today = What’s up in Mortgage Today (PM) – 03/06/2026
Bond markets delivered a wild rollercoaster ride today as February’s jobs report shocked traders with a negative 92,000 print against expectations of a 59,000 gain. The massive miss initially sent yields lower and MBS higher in a logical flight-to-safety move. But that relief rally evaporated by mid-morning as paradoxical selling pressure pushed yields to session highs despite the weak employment data.
The 10-year Treasury ultimately finished nearly flat at 4.13% after touching 4.176% during morning weakness and 4.113% at the afternoon peak. UMBS prices followed a similar whipsaw pattern, rallying briefly after the 8:30 AM jobs report before reversing sharply lower by 10:09 AM. Markets finally stabilized in afternoon trading, with MBS ending down just 2 ticks on the day after recovering from an eighth-point decline.
Oil prices surging past $90 per barrel added significant complexity to today’s market dynamics. Overnight weakness had already pressured bonds before the jobs data hit, with crude’s relentless climb raising inflation concerns. The fact that bonds managed to finish essentially unchanged despite oil’s breakout represents a modest victory for mortgage-backed securities.
Unemployment ticked up to 4.4% from 4.3% as the labor force participation rate dropped to 62.0% from 62.5%. Average hourly earnings rose 0.4%, matching forecasts and prior month readings. These mixed signals left traders uncertain whether weakening employment justifies rate cut expectations or whether wage pressures and oil prices demand continued Fed vigilance.
Stock markets reflected the economic uncertainty with the S&P 500 hitting its lowest levels since November. Fed funds futures continue pricing in higher odds of rate cuts this year despite persistent inflation signals. The disconnect between equity weakness and bond market hesitancy suggests investors remain deeply conflicted about the economic outlook.
January retail sales data also crossed the wires today, showing a 0.2% decline versus the 0.3% drop expected. The control group component actually rose 0.3%, beating the 0.2% forecast and reversing January’s 0.1% decline. This consumer spending resilience adds another layer to the already complicated economic picture facing mortgage originators.
Locking vs Floating
Market volatility remains significantly elevated due to ongoing geopolitical uncertainty and the heavy schedule of incoming economic data. Borrowers with near-term closings should strongly consider locking to avoid potential adverse movements. The current environment offers little reward for floating given the unpredictable intraday swings we witnessed today.
Today’s Events
Average earnings mm (Feb): 0.4% vs 0.3% forecast, 0.4% previous
Non Farm Payrolls (Feb): -92K vs 59K forecast, 130K previous
Participation Rate (Feb): 62.0% vs no forecast, 62.5% previous
Retail Sales (Jan): -0.2% vs -0.3% forecast, 0% previous
Retail Sales Control Group MoM (Jan): 0.3% vs 0.2% forecast, -0.1% previous
Unemployment rate mm (Feb): 4.4% vs 4.3% forecast, 4.3% previous
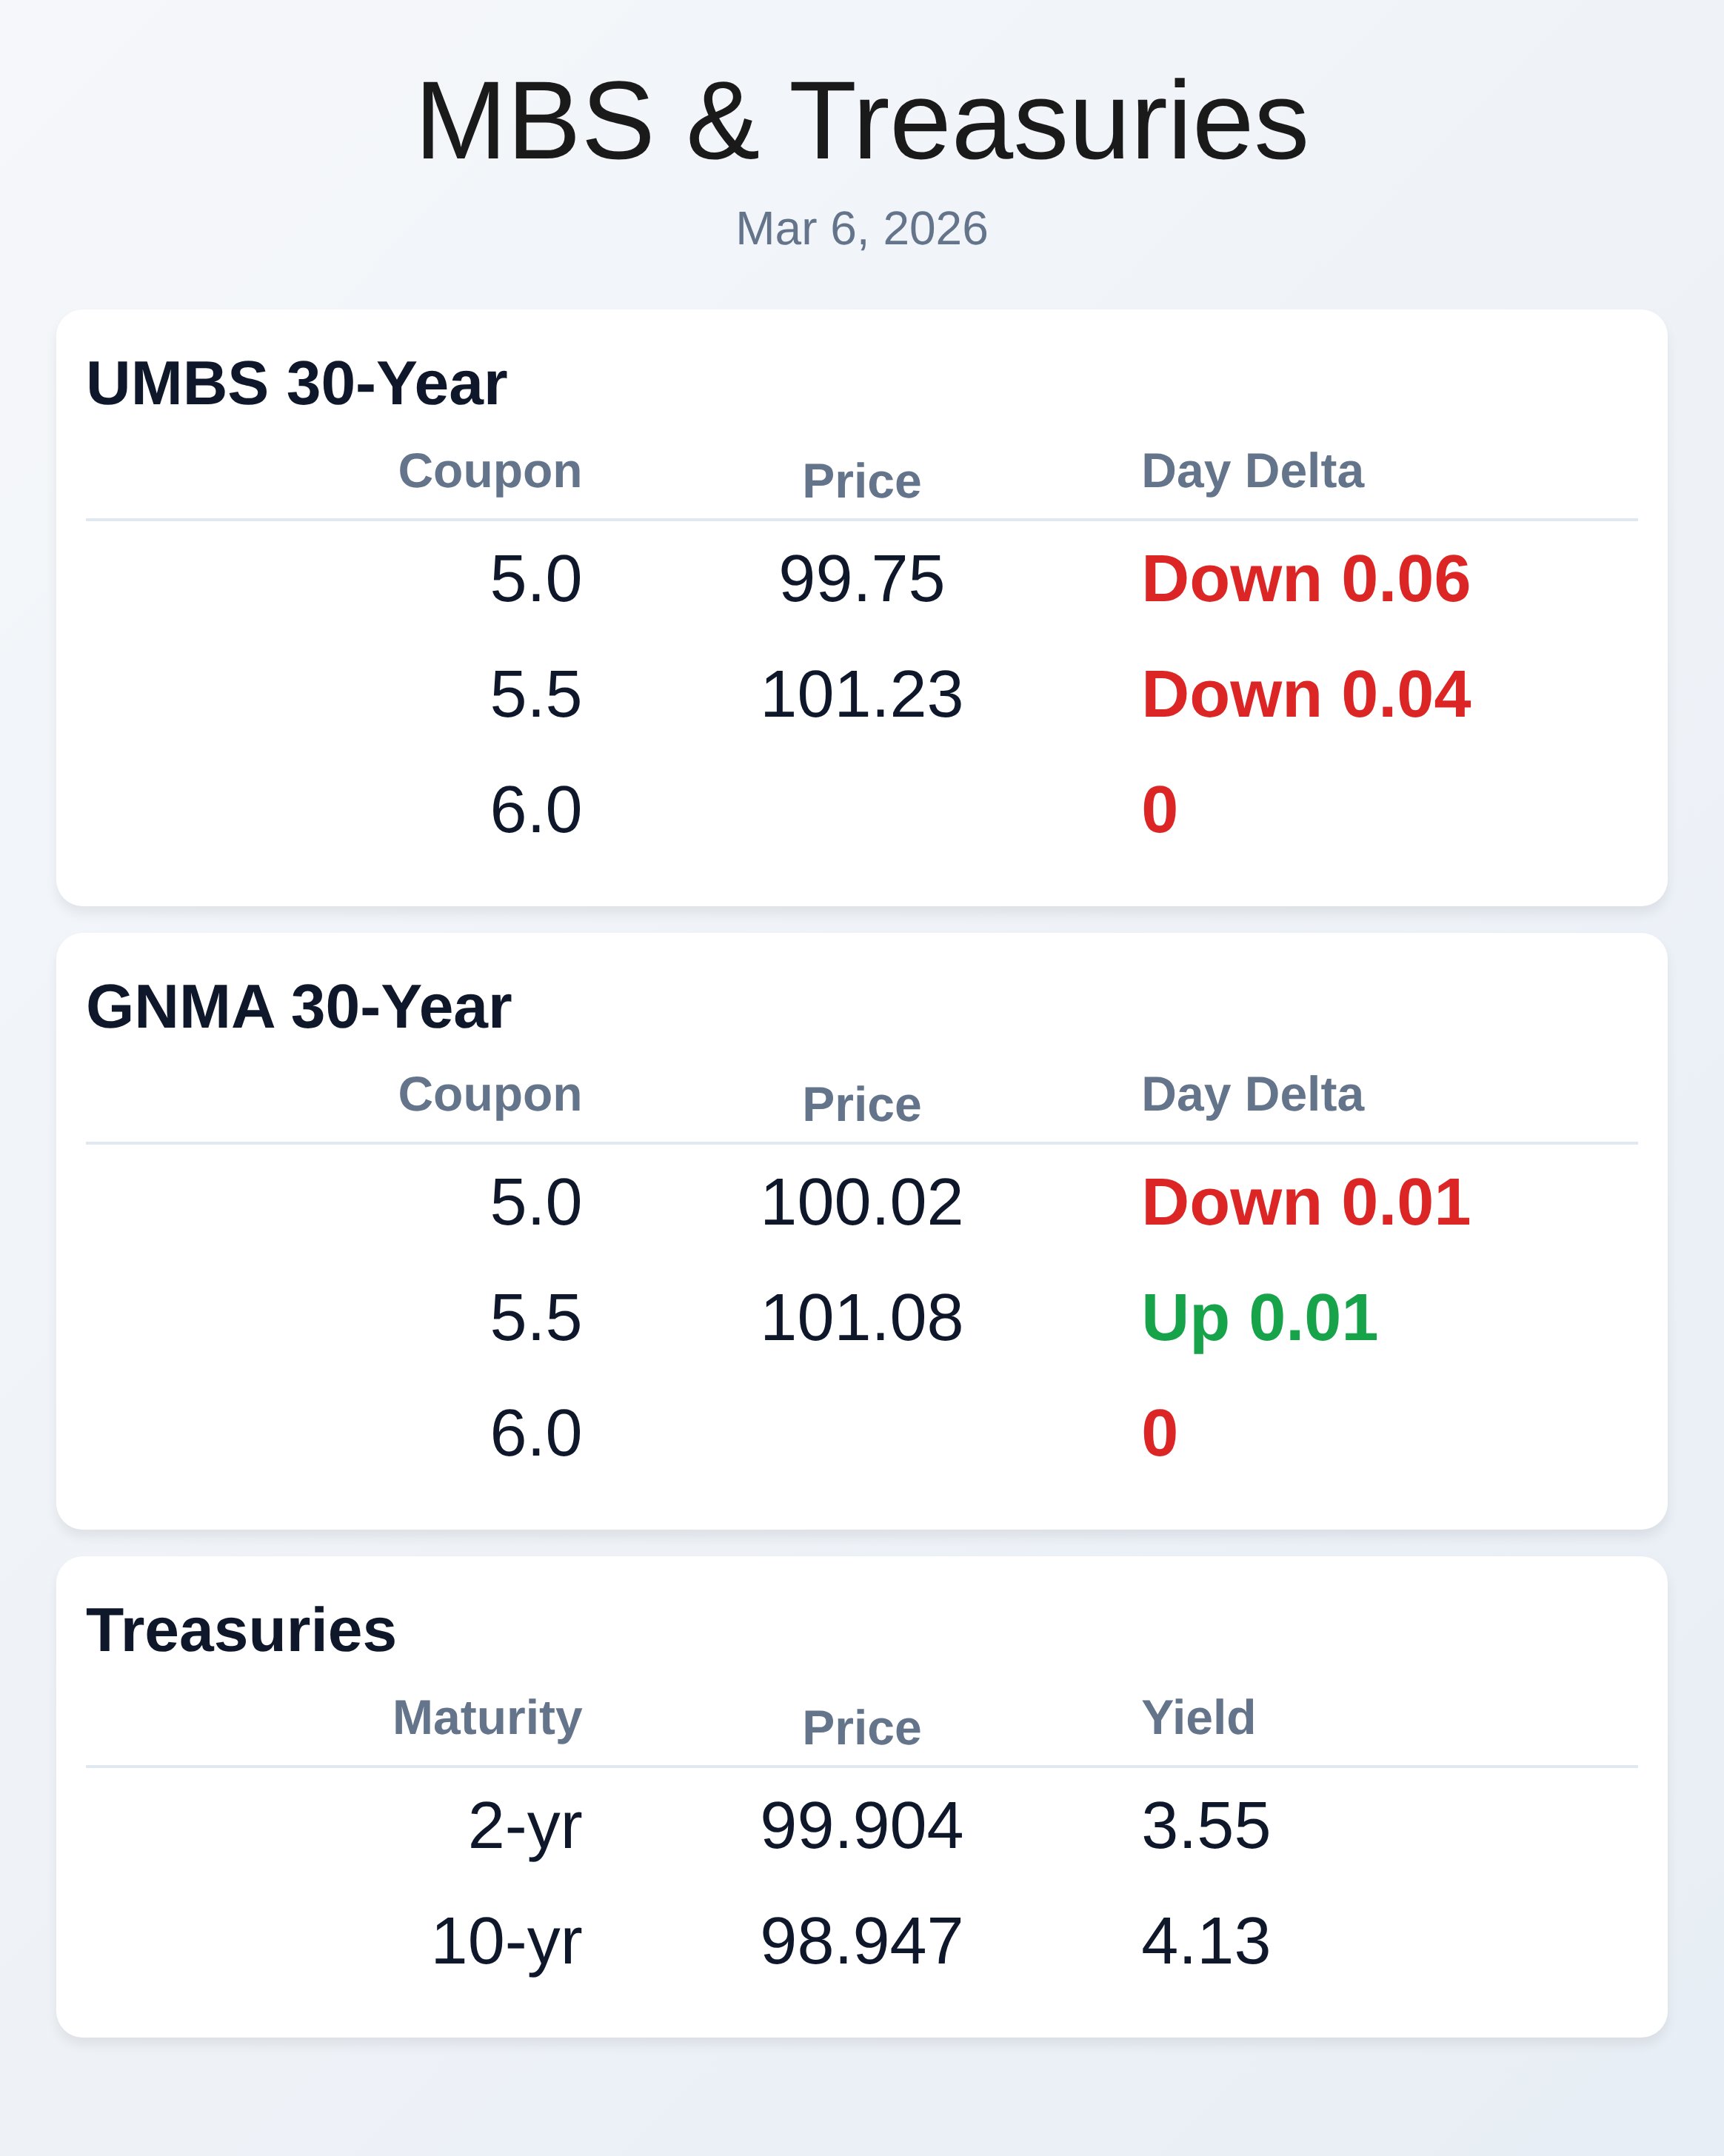
Bond Pricing
UMBS 30 yr
| Coupon | Price | Intra-Day Change |
| 5.0 | 99.75 | -0.06 |
| 5.5 | 101.23 | -0.04 |
| 5.0 | 100.02 | -0.01 |
GNMA 30 yr
| Coupon | Price | Intra-Day Change |
Treasuries
| Term | Yield | Price | Intra-Day Yield Change |
| 2 yr | 3.55 | 99.904 | -0.031 |
| 3 yr | 3.576 | 99.787 | -0.023 |
| 5 yr | 3.725 | 100.112 | -0.003 |
| 7 yr | 3.913 | 100.531 | -0.013 |
| 10 yr | 4.13 | 98.947 | -0.009 |
| 30 yr | 4.764 | 97.791 | 0.008 |