WTMS Blog Today = What’s up in Mortgage Today (PM) – 04/30/2026
Bonds shook off geopolitical nervousness and rallied into the close as oil prices retreated, pulling the 10-year yield down to 4.383% by 3:21 PM. MBS prices climbed 31 basis points on the day, signaling genuine bid strength in mortgages despite a heavy economic data dump that included strong jobs reports and sticky wage inflation.
Yesterday’s yield spike to 4.66% now looks like a potential technical ceiling—a pattern eerily similar to March 24–26 that could support another bounce if yields hold under 4.37%. The real question for originators isn’t whether this bounce holds; it’s whether this choppy, 30+ basis point intraday range becomes the new normal. This volatility destroys pipeline clarity and makes rate locks harder to sell when clients see the market swinging wild.
The Fed held rates flat yesterday but signaled serious internal division with four dissenting votes—the most since 1992. That split matters far more than the hold itself because borrowers don’t care what the Fed did; they care what comes next, and a fractured FOMC sends no clear signal about rate direction. With Powell’s tenure ending soon and his successor uncertain on inflation strategy, the market is pricing in “higher for longer with surprises,” which is exactly the environment where origination suffers most.
You can defend a 7% rate world if clients believe rates go higher. You can defend a 4% world if clients see cuts ahead. But a 4.38% world with a confused Fed heading into a leadership transition?
That’s when lock-unlock hesitation paralyzes pipelines. Economic data arrived mostly in line with expectations, which actually worked in bonds’ favor by removing surprise risk. Jobless claims fell to 189K versus 215K forecast—the lowest reading in over three years—but mortgages barely flinched, suggesting the market is already pricing in labor strength.
Core PCE inflation matched expectations at 0.3% month-over-month and 3.2% year-over-year, offering no fresh inflation shock. GDP came in at 2.0% annualized versus 2.3% expected, which is softer but not recessionary and not enough to spark a rate-cut narrative. When data cooperates this way, technicals and sentiment dominate, which is why the oil correlation mattered more than any single number on the calendar.
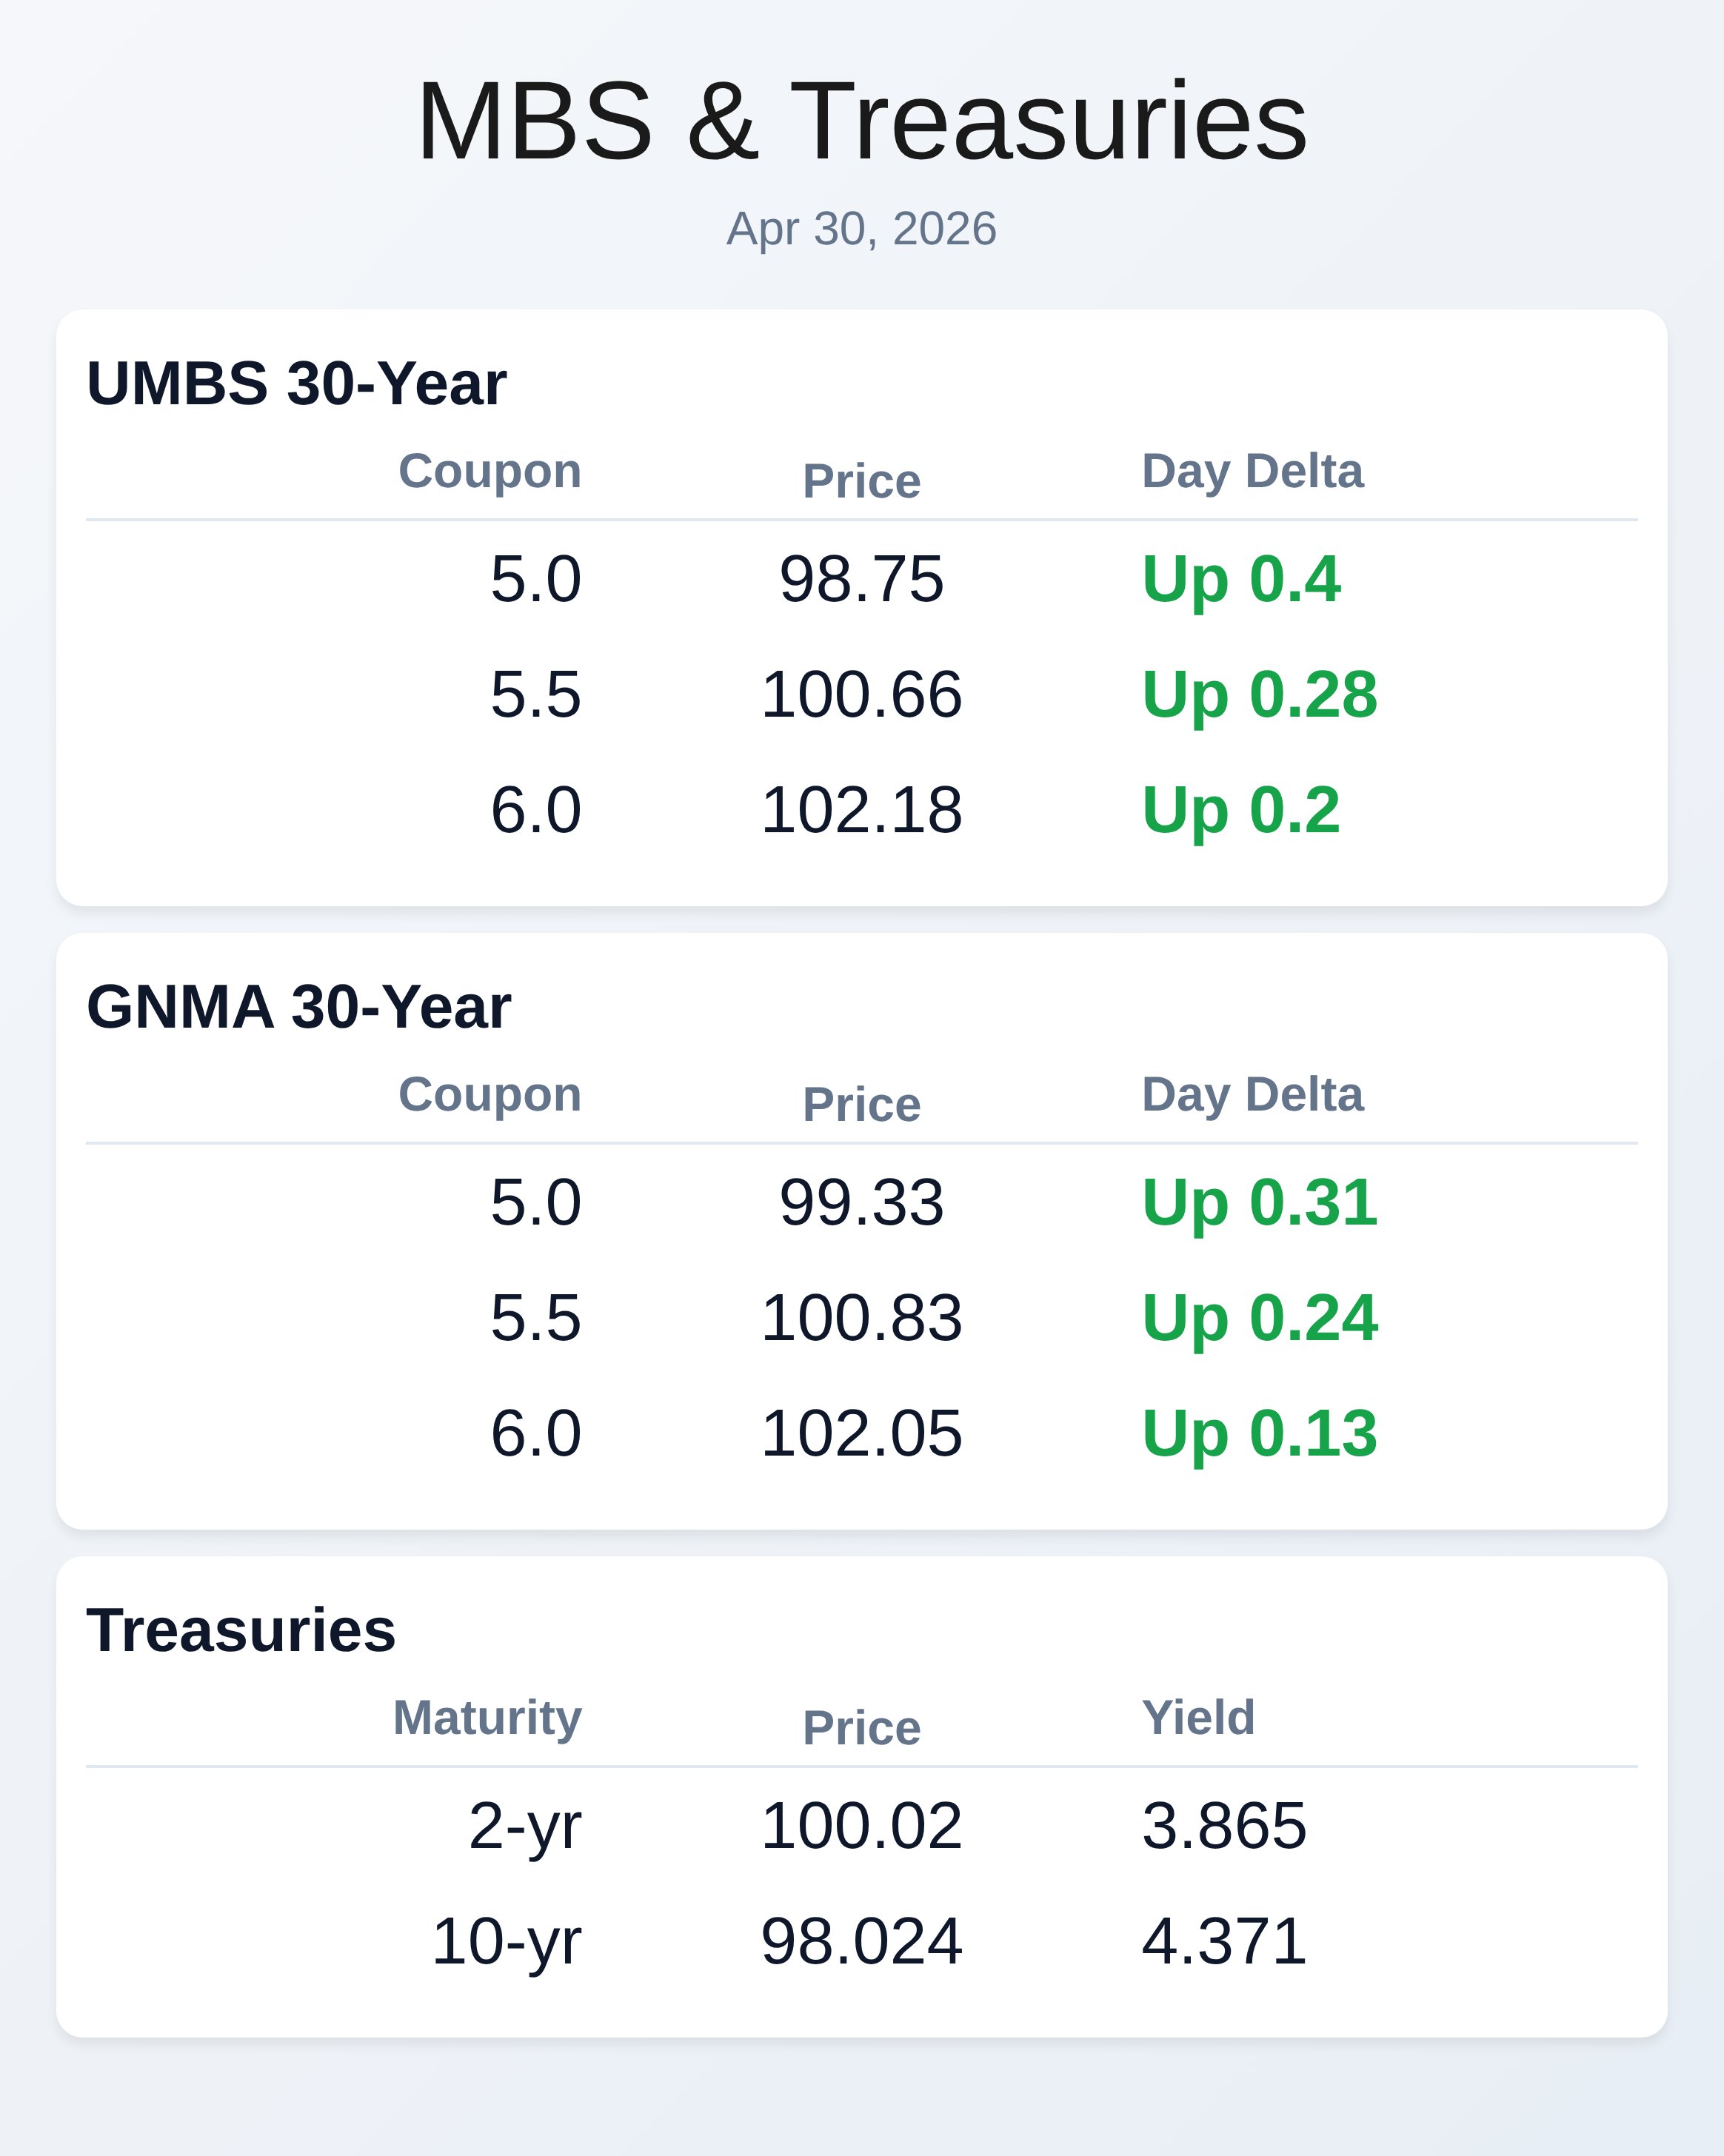
UMBS 30-year coupons posted solid intraday gains across the curve: the 5.0% coupon climbed 40 basis points to 98.75, the 5.5% gained 28 basis points to 100.66, and the 6.0% rose 20 basis points to 102.18. GNMA securities trended similarly but with slightly softer momentum, suggesting institutional demand is favoring agency UMBS paper over government mortgage-backed bonds. Treasury volatility compressed—the 2-year yield fell 8.2 basis points while the 30-year fell only 3.3 basis points—indicating a modest flattening bias as longer rates held firmer.
For lenders holding hedges, this curve behavior creates both cover-your-short opportunities and risk if the steepening resumes. The 10-year Treasury yield’s technical floor at 4.34–4.37% is now the most important level for originators to watch over the next 48 hours. If that breaks lower, expect another 4–6 basis point decline in primary mortgage rates as the market tests the 4.28–4.19% ceiling range, which could unlock a small wave of refi activity and ease origination pressure.
If yields bounce back above 4.40% instead, we’re back to the rangebound chop that killed productivity all April, and clients will hunker down until the Fed narrative clarifies or a new leadership team emerges. War-related headlines will likely remain the wildcard—small geopolitical flare-ups are now triggering 2–3 basis point swings faster than any economic release. The real origination test isn’t today’s 31-basis-point MBS pop; it’s whether lenders can convince borrowers that a fragmented Fed and 4.38% rates justify locking sooner rather than later.
Hesitation thrives in this gray zone where no direction is clear and surprise risk cuts both ways. Lock your stronger files while technicals favor yields under 4.40%; float only if you’ve earned enough pipeline flow to afford the volatility tax. The next 72 hours will tell us if this bounce is real support or just another false signal before yields resume climbing.
**Locking vs Floating**
Yesterday’s yield spike and today’s oil-driven rally illustrate why technical ceilings matter: if 4.66% was a genuine blow-off top, then yields pulling back under 4.40% could indicate early support forming. From a purely technical view, yesterday’s high yields matched those seen on March 24–26, suggesting this level has tested buyer interest twice before. From a market psychology view, volatility will continue to stem from geopolitical headlines and Fed messaging confusion, not from economics alone.
Lock borrowers in the 4.34–4.40% range; float if you’re chasing risk premium on a potential dip toward 4.20%.
**Today’s Events**
Continued Claims (Apr)/18: 1,785K vs 1,820K forecast, 1,821K prior
Core PCE (m/m) (Mar): 0.3% vs 0.3% forecast, 0.4% prior
Core PCE (y/y) (Mar): 3.2% vs 3.2% forecast, 3.0% prior
Core PCE Prices QoQ Q1: 4.3% vs 4.1% forecast, 2.7% prior
Employment Costs Q1: 0.9% vs 0.8% forecast, 0.7% prior
GDP Q1: 2.0% vs 2.3% forecast, 0.5% prior
Jobless Claims (Apr)/25: 189K vs 215K forecast, 214K prior
PCE (y/y) (Mar): 3.5% vs 3.5% forecast, 2.8% prior
PCE prices (m/m) (Mar): 0.7% vs 0.7% forecast, 0.4% prior
**Bond Pricing**
**UMBS 30 yr**
| Coupon | Price | Intra-Day Change |
**GNMA 30 yr**
| Coupon | Price | Intra-Day Change |
**Treasuries**
| Term | Yield | Price | Intra-Day Yield Change |
| 2 yr | 3.865 | 100.02 | -0.082 |
| 3 yr | 3.889 | 98.908 | -0.078 |
| 5 yr | 4.003 | 99.426 | -0.074 |
| 7 yr | 4.186 | 100.384 | -0.065 |
| 10 yr | 4.371 | 98.024 | -0.057 |
| 30 yr | 4.966 | 96.646 | -0.033 |