WTMS Blog Today = What’s up in Mortgage Today (PM) – 10/22/2025
MBS markets finally showed some fatigue after an exceptionally strong rally that peaked yesterday. The UMBS 5.0 coupon pulled back modestly from its best levels in over a year. Think of this as a natural pause after an impressive climb rather than a concerning reversal.
Economic data delivered mixed signals with Philadelphia Fed business activity plunging deeper into negative territory. Employment conditions weakened significantly, dropping from +9.4 to -4.5. New orders also contracted sharply, falling from +0.5 to -17.4, indicating potential slowdown in the services sector.
The 10-year Treasury yield tested higher but remained below 4.0%, hovering around 3.97%. This consolidation near recent lows suggests the bond market rally may continue despite today’s modest retreat. Oil prices have rebounded slightly, which could provide some headwinds to further Treasury gains.
Refinance applications surged 81% compared to last year as borrowers capitalize on the recent rate improvements. Purchase applications dropped 5% for the week but remain 20% higher year-over-year. ARM share increased to 11% as borrowers explore alternative products in this rate environment.
Locking vs Floating
Risk-averse clients should remain locked as rates continue testing multi-month lows. Risk-tolerant borrowers can maintain float positions while monitoring for any major corrections. The trend remains favorable, but today’s pullback reminds us that consolidation periods are natural after strong rallies.
Today’s Events
Philly Fed Non-Manufacturing Business Activity: -22.2 vs -12.3 previous
– Employment: -4.5 vs +9.4 previous
– New orders: -17.4 vs +0.5 previous
– Prices: 35.8 vs 38.8 previous
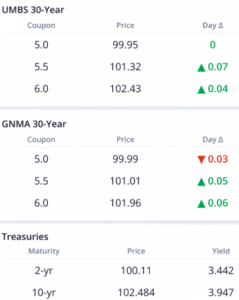
Bond Pricing
UMBS 30 yr
| Coupon | Price | Intra-Day Change |
| 5.0 | 99.92 | -0.04 |
| 5.5 | 101.27 | 0.02 |
| 6.0 | 102.4 | 0.01 |
GNMA 30 yr
| Coupon | Price | Intra-Day Change |
| 5.0 | 99.95 | -0.07 |
| 5.5 | 101.01 | 0.04 |
| 6.0 | 101.9 | 0 |
Treasuries
| Term | Yield | Price | Intra-Day Yield Change |
| 2 yr | 3.457 | 100.082 | 0.002 |
| 3 yr | 3.461 | 100.111 | 0.004 |
| 5 yr | 3.569 | 100.255 | 0.003 |
| 7 yr | 3.75 | 100.762 | 0.004 |
| 10 yr | 3.97 | 102.294 | 0 |
| 30 yr | 4.55 | 103.257 | 0.003 |