**WTMS Blog Today = What’s up in Mortgage Today (AM) – 06/29/2026**
MBS underperformed to start the week as the 10-year Treasury climbed 1.6 basis points to 4.383 percent while UMBS 6.0 coupon dropped 7 ticks to 102.26. The flat overnight session gave way to mild selling pressure at 8:20 a.m., reflecting typical quarter-end positioning ahead of a quieter holiday week. Intraday volatility remained contained with GNMA securities showing broader weakness across coupons.
The broader bond market gained traction last week as easing geopolitical tensions and plummeting energy prices reduced inflation shock concerns. Agency MBS held up better than expected despite falling rates, though originators faced margin pressure from widening primary-secondary spreads without a corresponding boost in loan production. Artificial intelligence adoption continues to dominate mortgage industry conversations, but actual borrower usage remains the true success metric for deployed technology.
Industry experts increasingly recognize that technical sophistication alone fails if lenders introduce complexity rather than streamline processes for customers. The most successful technology implementations—like electronic promissory notes—operate invisibly to borrowers while modernizing back-end workflows substantially. Rather than replacing employees, lenders now deploy AI to automate repetitive tasks like document processing and reporting, freeing teams to focus on exception handling and relationship management.
First-time homebuyers require education and ongoing communication, while repeat borrowers prioritize speed and minimal touchpoints, pushing lenders to design flexible workflows instead of rigid standardized models. Conventional conforming updates accelerated as Fannie Mae, Freddie Mac, and correspondent lenders announced overlays and policy changes effective immediately through June. Fannie Mae reminded originators to meet the Uniform Appraisal Dataset 3.6 deadline of November 2, 2026, and published guidance on new escrow reporting requirements including expanded loan data and principal-interest remittance procedures.
PennyMac issued consecutive LLPA updates on June 23 and June 26, 2026, affecting best-efforts commitments with immediate impact to pricing. Newrez Correspondent updated conventional and government overlay documents effective for pipeline and new applications dated June 25, 2026 forward. These frequent guideline shifts underscore that standard conforming remains the volume game, forcing lenders to stay vigilant on compliance or face sellback risk and operational friction.
Freddie and Fannie continue driving the volume game as agency g-fees ratchet higher, pushing lenders toward cash execution and alternative channels for loan sales. The week’s marquee economic event arrives Thursday with the June nonfarm payrolls report, where economists expect 115,000 job additions—down from May’s 172,000—with unemployment holding steady at 4.3 percent. Tuesday’s releases include April FHFA and S&P Case-Shiller housing indices, June Chicago PMI, and Consumer Confidence data.
Wednesday brings June ADP employment, manufacturing PMI, May construction spending, and ISM Manufacturing Index before Treasury markets close early at 2 p.m. Thursday. With bond and equity markets closed Friday for Independence Day, this compressed week tests whether resilient economic data keeps Fed tightening alive or signals soft-landing momentum.
Capital markets pricing continues to reflect uncertainty on Federal Reserve intentions despite last week’s economic resilience data. First-quarter growth relied disproportionately on business investment in AI infrastructure rather than household consumption, raising questions about economic durability if that spending normalizes. Kevin Warsh’s hawkish Fed debut and forthcoming ECB Sintra conference remarks this week will reshape rate expectations, though energy price declines reduce tightening urgency and support longer-duration bond demand.
The 10-year yield now sits at its lowest level in nearly eight weeks while the 2-year hit lows unseen in over a week, extending the recent rally. Elevated core PCE inflation remains the primary obstacle at the front end of the Treasury curve, though moderating inflation expectations and easing energy costs continue supporting the broader bond market’s recent momentum. The industry’s quiet pre-holiday week masks strategic conversations about mortgage operations, workforce readiness, and AI governance frameworks now dominating leadership discussions.
This week’s Chrisman video lineup features Brian Conneen discussing AI and fintech lessons for housing finance, Nicole Nosek on millennial homeownership trends, and panelists examining AI adoption realities beyond hype. Clear Capital data reveals that appraisal modernization adoption remains uneven despite clear efficiency gains, while inspection-based waivers gain traction as cultural and operational barriers slow UAD uptake. The daily mortgage news podcast interviews industry voices on valuation, capital markets, and operational strategy as lenders prepare for second-half execution under continuing regulatory pressure.
Subscribe free at WellThatMakesSense.com to stay current on market moves and mortgage industry strategy.
**Locking vs Floating**
Borrowers should maintain caution heading into quarter-end given random volatility spikes remain possible, though the week’s calm finish offered some reassurance on front-end stability. War-related headlines still circulate but require stronger evidence before bond markets react meaningfully.
Next week presents larger volatility risks from big-ticket economic data, particularly Thursday’s employment report, which will reset rate expectations significantly.
**Today’s Events**
No scheduled economic data released today. Markets open with flat overnight conditions and modest selling pressure established at market open.
**Bond Pricing**
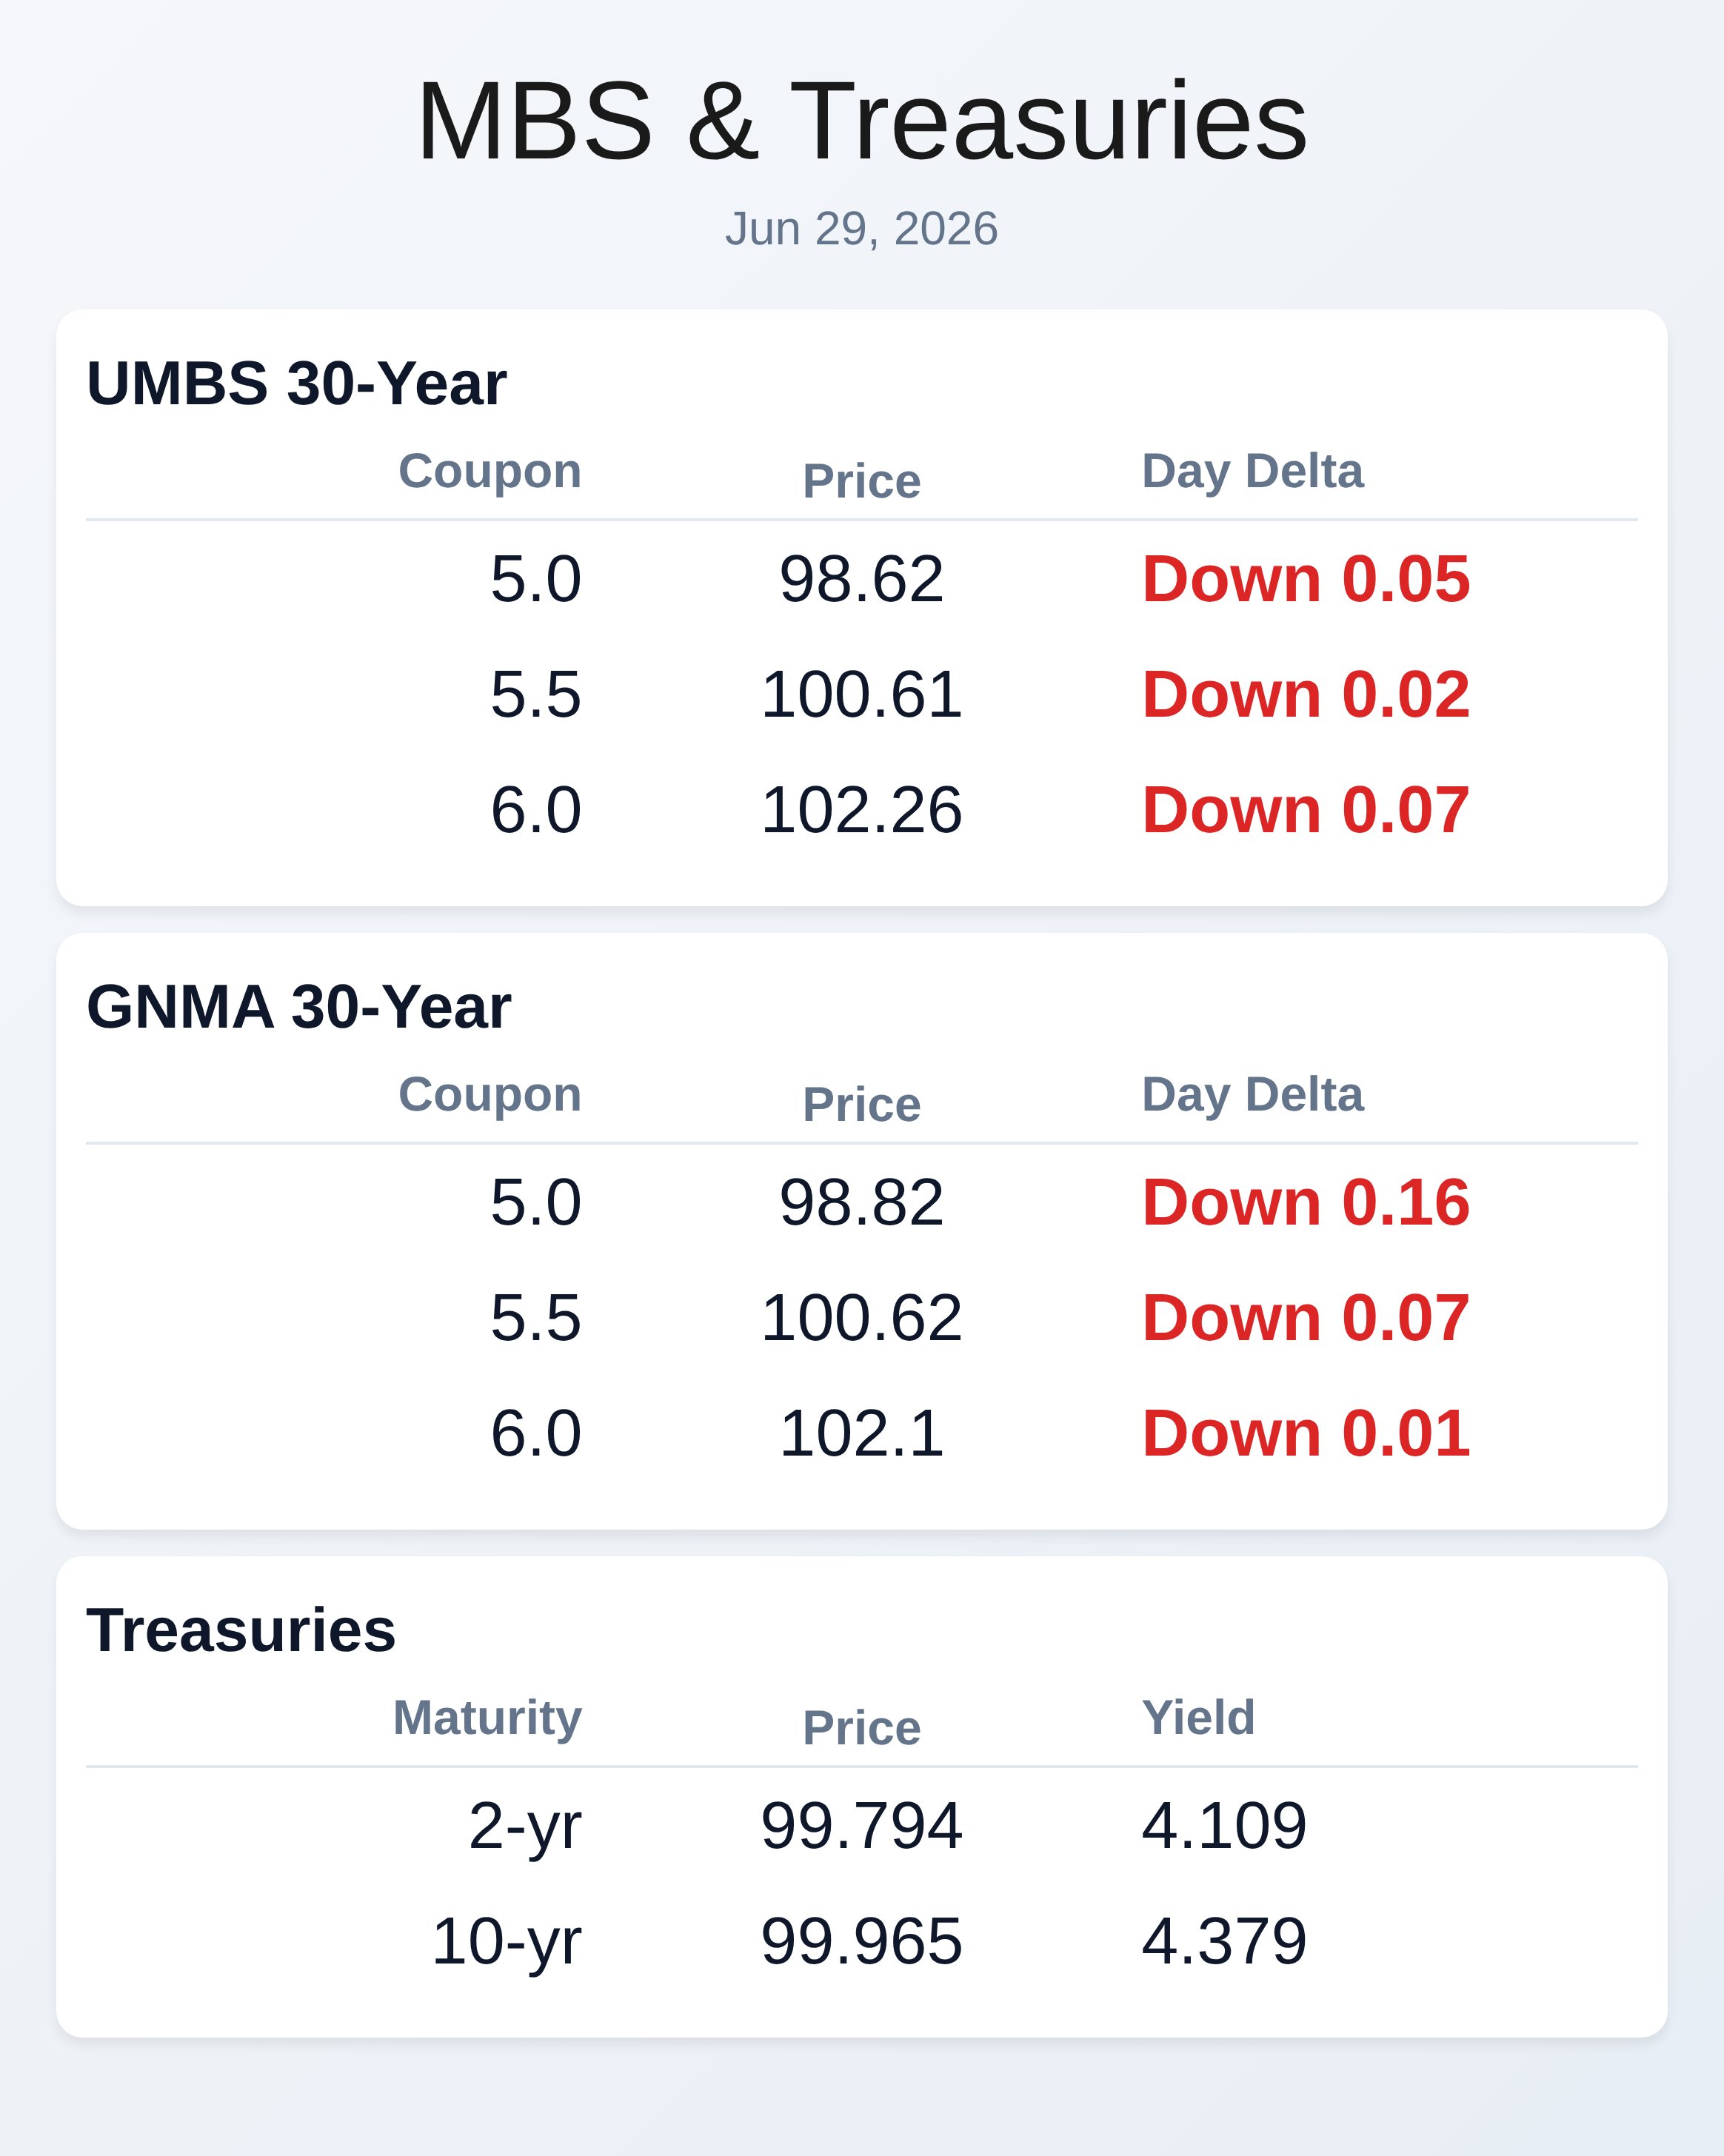
**UMBS 30 yr**
| Coupon | Price | Intra-Day Change |
| 5.0 | 98.62 | -0.05 |
| 5.5 | 100.61 | -0.02 |
| 6.0 | 102.26 | -0.07 |
**GNMA 30 yr**
| Coupon | Price | Intra-Day Change |
| 5.0 | 98.82 | -0.16 |
| 5.5 | 100.62 | -0.07 |
| 6.0 | 102.1 | -0.01 |
**Treasuries**
| Term | Yield | Price | Intra-Day Yield Change |
| 2yr | 4.109 | 99.794 | 0.014 |
| 3yr | 4.11 | 100.041 | 0.014 |
| 5yr | 4.145 | 99.912 | 0.017 |
| 7yr | 4.251 | 99.992 | 0.017 |
| 10yr | 4.379 | 99.965 | 0.013 |
| 30yr | 4.861 | 102.181 | -0.007 |