**WTMS Blog Today = What’s up in Mortgage Today (AM) – 09/03/2026**
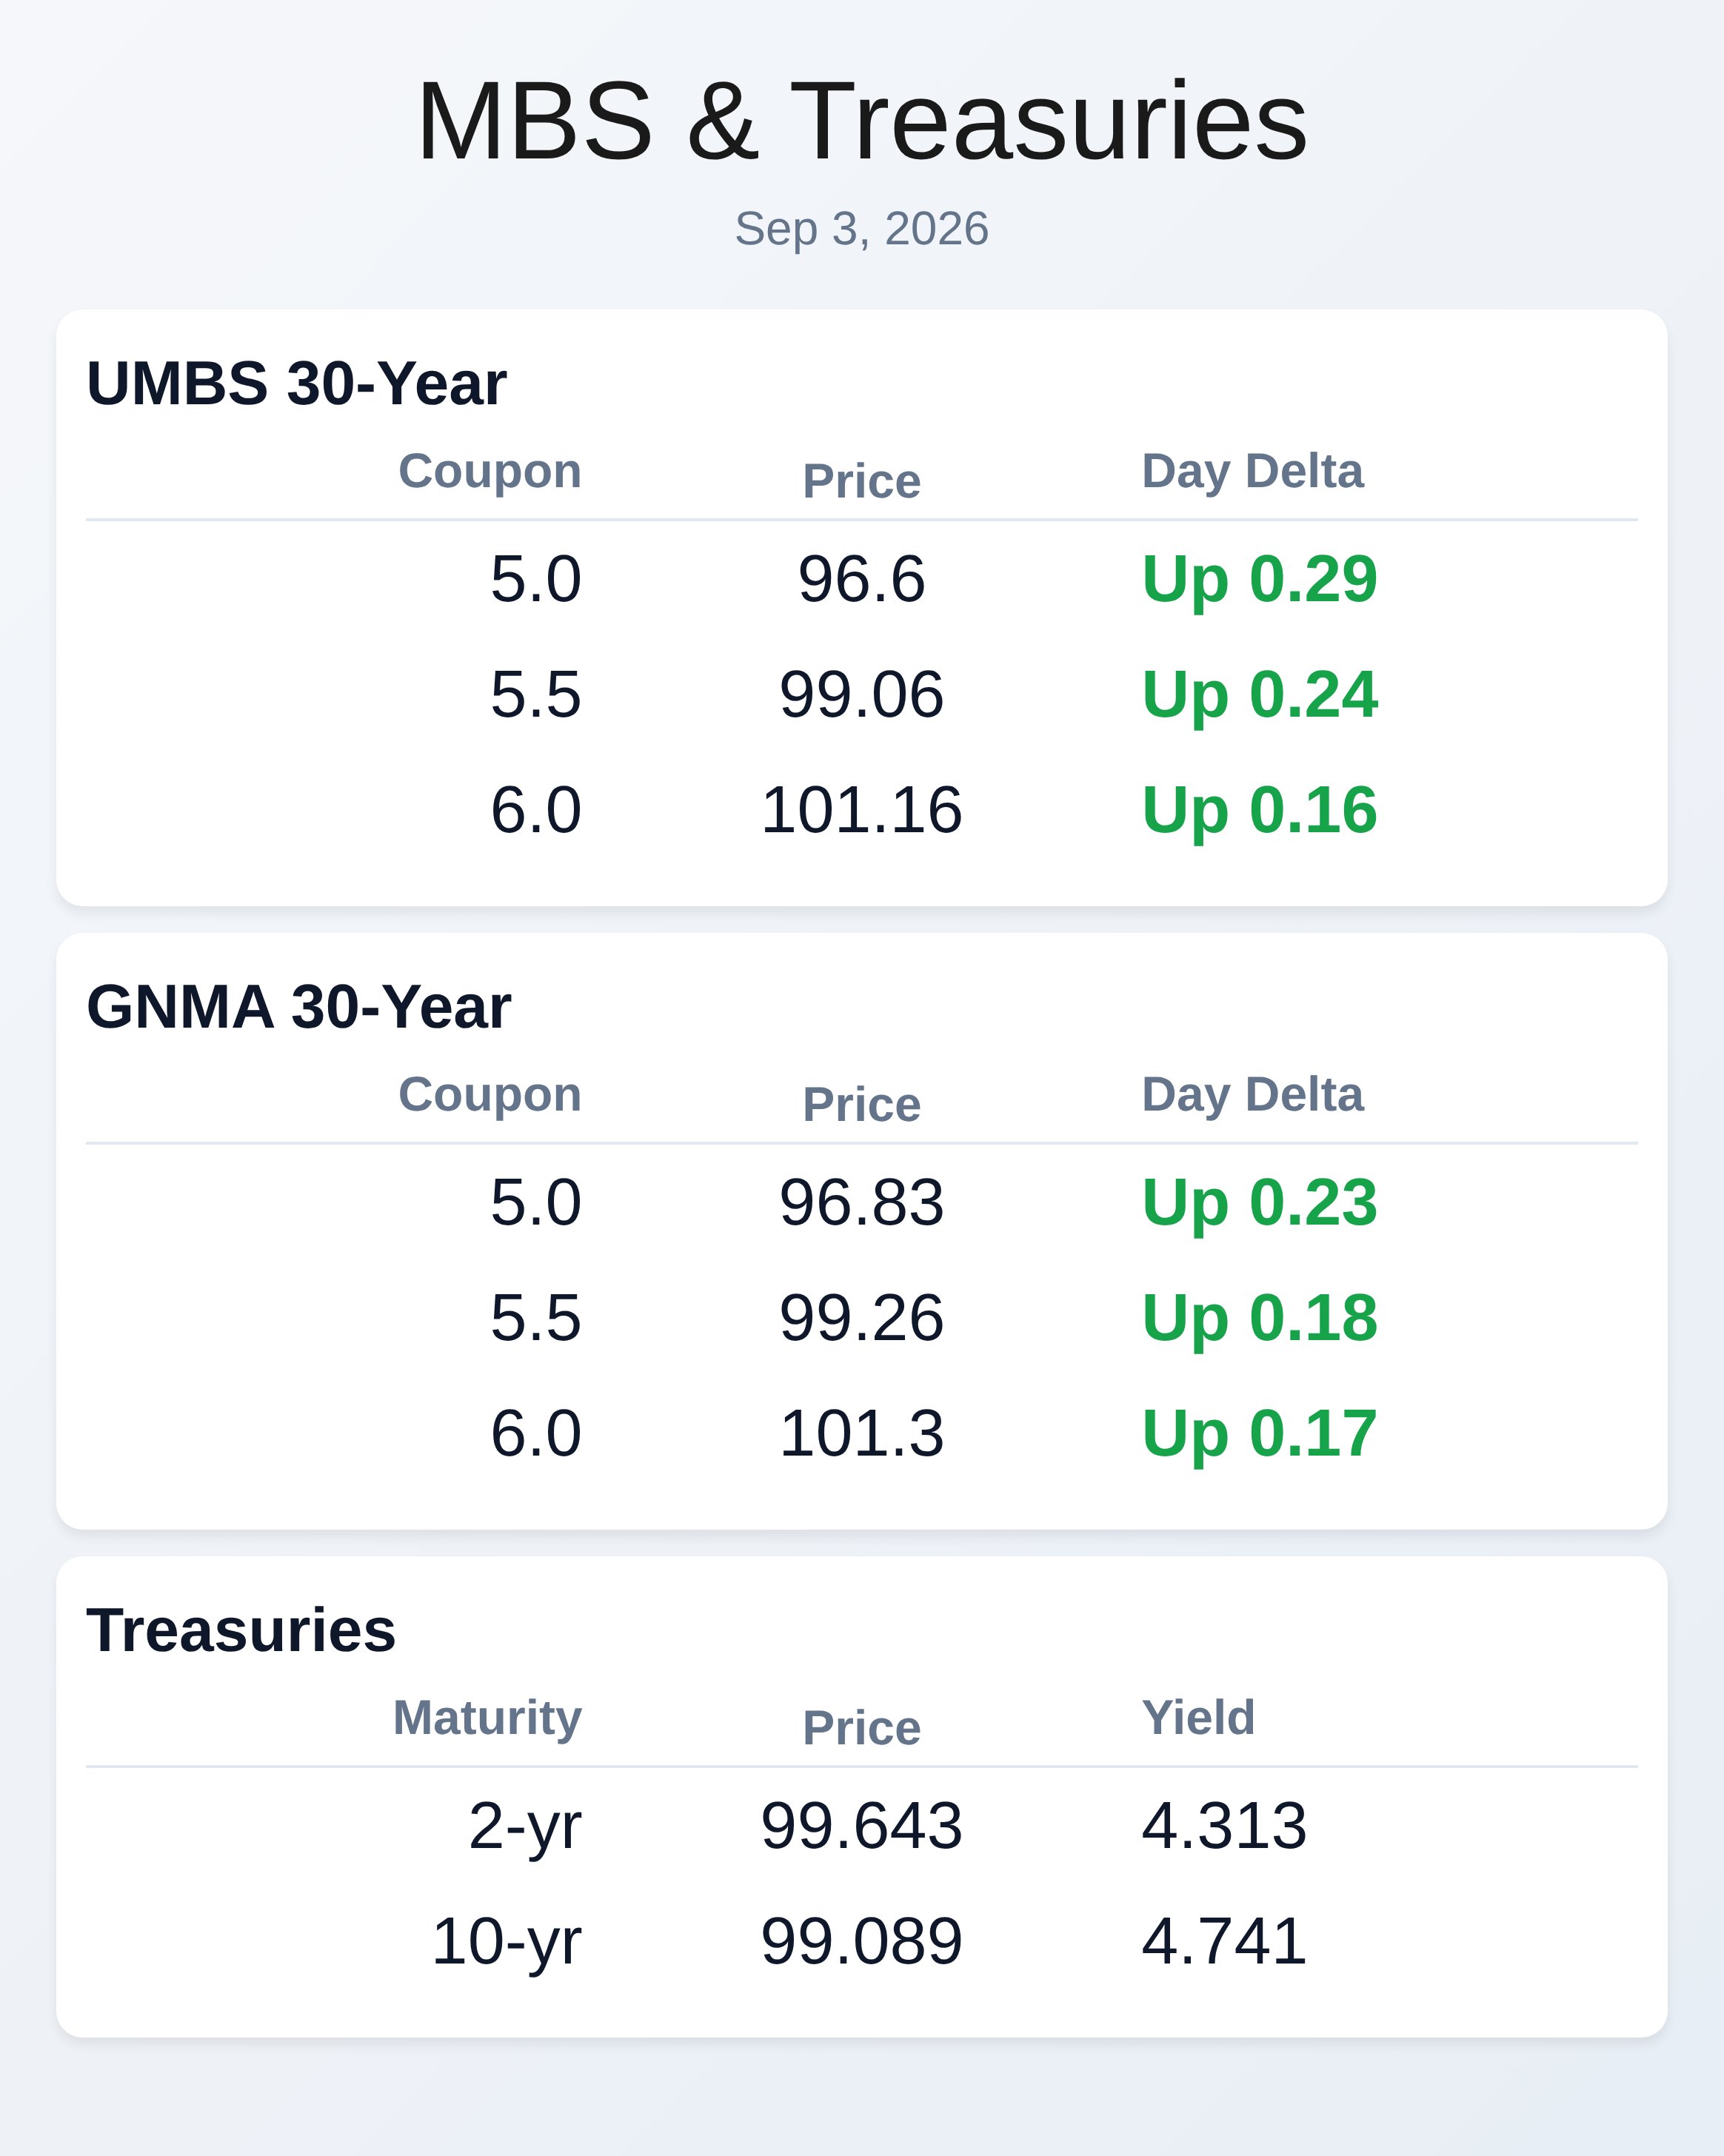
Mortgage-backed securities edged higher on Thursday morning as bond yields retreated from recent multi-year highs, with MBS prices climbing roughly a quarter point following Fed Vice Chair Waller’s speech. The 10-year Treasury yield fell 3.6 basis points to 4.744 percent, signaling renewed demand for fixed-income assets despite persistent geopolitical risks tied to oil price volatility. UMBS 5.0 coupons jumped 29 basis points to 96.6, while GNMA securities followed suit with comparable gains across the yield curve.
This modest rally occurred even as war headlines and energy concerns created ongoing headwinds for the broader market. The market is pricing roughly a 70 percent probability of a September Fed rate hike. Economic data released today painted a mixed picture for labor markets and inflation, with jobless claims coming in slightly hotter than forecast at 206,000 versus a 205,000 estimate.
Continued claims held steady at 1.779 million, suggesting labor demand remains resilient despite recent layoff announcements that jumped 58 percent month-over-month to 52,881 in August. The July trade deficit narrowed unexpectedly to $88.6 billion, beating estimates of a $90.2 billion shortfall, as imports rose and exports fell in seasonal patterns. Unit labor costs came in softer than expected at 1.2 percent on a quarter-over-quarter basis, potentially offering inflation relief.
These mixed signals leave the Fed’s policy path uncertain heading into next week’s jobs report. Treasury yields stabilized overnight as oil prices pulled back from earlier highs, easing immediate inflation concerns that had driven the curve higher earlier in the week. The 2-year yield fell 5.6 basis points to 4.313 percent, while longer-dated securities saw smaller declines across the curve.
European bond yields also retreated, with Germany’s 10-year yield dropping two basis points, suggesting a broader global easing in fixed-income markets. Fed Chair Warsh’s hawkish stance on financial conditions remains a wildcard, as he faces pressure to either contain inflation or accommodate President Trump’s monetary policy preferences. The reality is that accommodative credit conditions and strong data-center demand continue supporting economic activity despite pockets of weakness.
Mortgage originators should monitor the week’s calendar closely, as final August services PMI and the ISM Non-Manufacturing Index arrive later today alongside ongoing Fed speaker commentary. Tomorrow’s jobs report represents the most critical economic data point for rate direction before Labor Day’s market closure on Monday, meaning origination volumes may shift based on employment surprises. Secondary market teams are already positioning for potential execution volatility if rates continue drifting downward, though hedging costs remain elevated relative to recent history.
The trade deficit beat and softer labor cost data are supporting bond prices, but oil risks and geopolitical uncertainty could reverse gains quickly. Locking-minded borrowers should act today before any afternoon reversal.
**Locking vs Floating**
War headlines and oil price volatility present persistent risks for market swings, so remaining defensive until clearer trend reversals emerge is warranted for originators managing pipeline risk.
Jobless claims data slightly exceeded forecasts, but unit labor costs came in softer than expected, creating conflicting signals about rate direction. The trade deficit surprise to the downside supports bond prices temporarily, but execution teams must stay alert to afternoon reversals given geopolitical headlines.
**Today’s Events**
Continued Claims (Aug)/22: 1.779 million vs.
1.778 million prior
Jobless Claims (Aug)/29: 206,000 vs. 205,000 forecast, 203,000 prior
Trade Gap (Jul): -$88.6 billion vs. -$90 billion forecast, -$73.3 billion prior
Unit Labour Costs QoQ FinalQ2: 1.2% vs.
1.3% forecast, 1.3% prior
**Bond Pricing**
**UMBS 30 yr**
| Coupon | Price | Intra-Day Change |
|5.0|96.6|0.29|
|5.5|99.06|0.24|
|6.0|101.16|0.16|
**GNMA 30 yr**
| Coupon | Price | Intra-Day Change |
|5.0|96.83|0.23|
|5.5|99.26|0.18|
|6.0|101.3|0.17|
**Treasuries**
| Term | Yield | Price | Intra-Day Yield Change |
|2 yr|4.313|99.643|-0.056|
|3 yr|4.383|99.629|-0.052|
|5 yr|4.487|99.506|-0.045|
|7 yr|4.604|99.383|-0.045|
|10 yr|4.741|99.089|-0.04|
|30 yr|5.228|98.455|-0.033|