**WTMS Blog Today = What’s up in Mortgage Today (AM) – 09/01/2026**
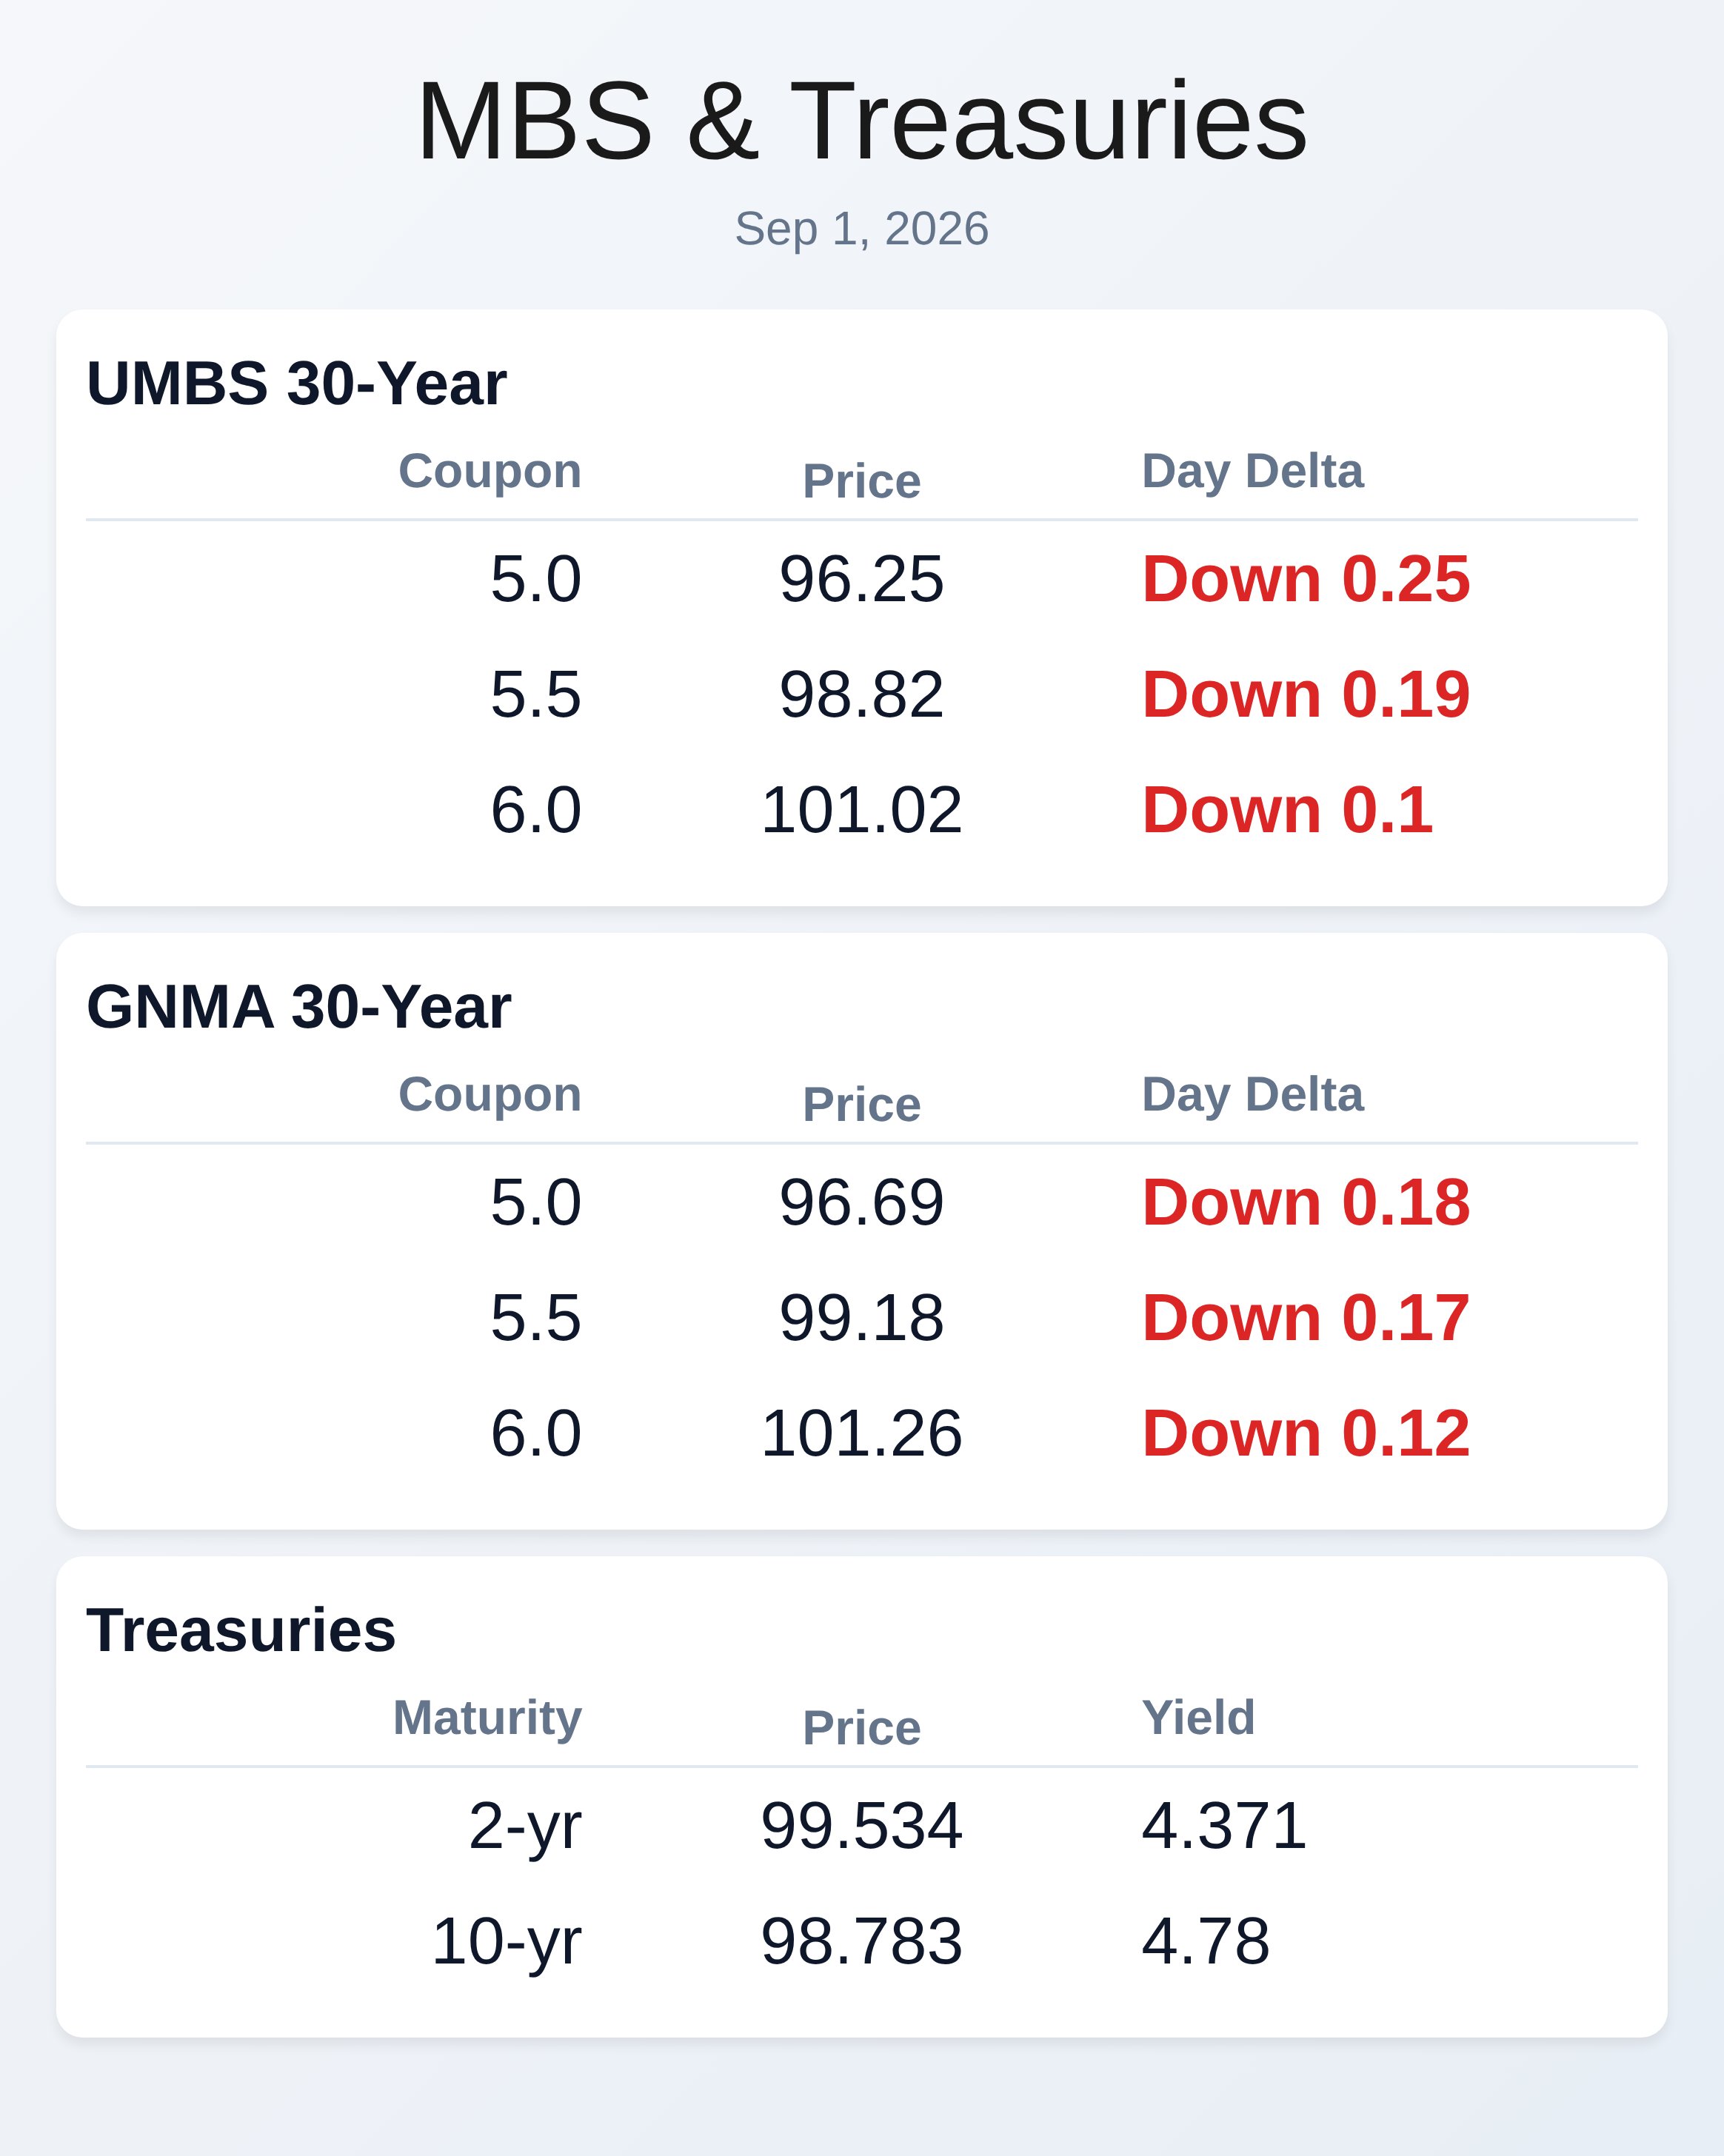
Bond markets delivered another gut-punch to mortgage originators on Tuesday morning as geopolitical tensions and inflation fears pushed the 10-year Treasury yield to 4.78%, its highest level since January 2025. UMBS 30-year securities fell a quarter point to 96.25 on the 5.0 coupon, while GNMA securities posted similar weakness across all coupons. Oil surged above $92 per barrel after attacks on tankers in the Strait of Hormuz reignited Middle East concerns, accelerating the selloff that started with Federal Reserve Vice Chair Kevin Warsh’s hawkish Jackson Hole remarks.
The negative momentum feels relentless, with traders now pricing a 70% probability of a September rate hike. Technical support levels broke yesterday, signaling deeper weakness could persist unless inflation data provides relief. Treasury yields climbed across the entire curve on Tuesday, with the 2-year jumping to 4.371% and the 5-year hitting 4.533%.
Thirty-year yields extended their run above 5%, marking the longest stint above that level since 2006—a historic signal of long-term inflation and growth concerns. Global bond markets deteriorated sharply, with UK gilts underperforming European peers and Japanese 10-year yields hitting their highest level this century as Treasury Secretary Scott Bessent pressed the Bank of Japan to tighten policy. The dollar strengthened against most major currencies while equities stumbled, with S&P 500 futures down 0.6% and Nasdaq 100 futures down 1.1% reflecting flight-to-quality selling.
This combination of rising rates and falling stocks typically signals recession fears, which could eventually help mortgage origination costs if volumes spike from distressed refinancing activity. The mortgage industry confronts a brutal operating environment that’s forcing consolidation and technological change across the sector. Origination costs hover around $11,000 per loan while pull-through rates remain weak, leaving lenders searching for scale and operational discipline to survive.
Industry leaders like Union Home’s Bill Cosgrove argue that consolidation now is about finding balance-sheet strength and talent rather than chasing volume in a market where “being merely average operationally is becoming increasingly difficult to sustain.” Canopy Mortgage recently passed 800 employees by targeting loan originators exhausted by bait-and-switch guarantees and artificial teaser rates from competitors. The path forward requires fundamental changes to loan origination economics through technology and operational rigor, not financial engineering alone. Fannie Mae and Freddie Mac continue adapting to evolving borrower demographics and shifting refinance demand patterns.
Fannie Mae reported $4.0 billion in net income for Q2 2026, while Freddie Mac posted $3.8 billion—a 61% increase year-over-year—as credit loss provisions swung dramatically in their favor. Freddie Mac’s Bulletin 2026-10 overhauled key lending guidelines, dropping the division factor from 240 to 180, removing the 80% LTV ceiling, and opening eligibility to all occupancy types with a new $30,000 minimum. Meanwhile, debt-driven refinancing opportunities remain largely untapped, with Total Expert highlighting that 20–30% of average lender databases may be ready for cash-out refi and HELOC conversations backed by record home equity levels.
Reverse mortgages and second-lien products are gaining traction as lenders search for volume among seniors, with roughly 36% of homeowners aged 75+ currently denied traditional HELOCs. Mortgage servicing rights valuations face a recalibration in this “higher for longer” rate environment where historical pricing models no longer fit current market dynamics. MSR values depend far more on Treasury yield curves, mortgage basis, and liquidity conditions than on mortgage rates alone, meaning a single valuation model spanning multiple years produces unreliable guidance.
Bulk MSR multiples appear elevated in absolute terms, yet that assessment means less given historically high mortgage rates, while new-issue and SRP pricing has surprisingly flatlined relative to primary rates. This divergence between bulk and new-issue markets creates pricing inefficiencies that savvy servicers and investors can exploit. Understanding these nuances becomes critical as firms evaluate portfolio management and potential M&A opportunities in a consolidating sector.
Economic data this week will prove crucial for Fed policy direction, starting with today’s August ISM Manufacturing Index and July job openings data. August inflation readings next week will carry far more weight than payrolls for determining whether the Fed hikes on September 16, with Vice Chair Warsh’s recent hawkish signals suggesting the central bank’s inflation-fighting priority now overshadows labor market concerns. If sticky inflation data emerges, expect the new dot plot to signal additional tightening beyond September, reinforcing upward pressure on front-end yields and extending the mortgage rate grind that originated at Jackson Hole.
Friday’s payrolls report and next week’s CPI print will shape mortgage market activity through month-end, so originators should prepare for potential volatility as positioning shifts around each data release.
**Locking vs Floating**
Morning weakness on August 31 tested key technical support levels for both MBS and Treasury bonds, though that weakness may have stemmed from temporary factors rather than fundamental deterioration. Investors should remain defensive until a clear reversal emerges in the broader negative trend, as attempting to time correction rallies amid downward momentum proves nearly impossible.
Higher ceilings and floors on 10-year yields now guide bigger-picture bond market direction more reliably than intraday MBS movements, so tracking Treasury positioning helps explain where rates are headed over the coming weeks.
**Today’s Events**
August ISM Manufacturing Index (final reading)
July Job Openings
July Construction Spending
August ISM Manufacturing Index (preliminary)
Fed Vice Chair for Supervision Barr remarks
**Bond Pricing**
**UMBS 30 yr**
| Coupon | Price | Intra-Day Change |
| 5.0 | 96.25 | -0.25 |
| 5.5 | 98.82 | -0.19 |
| 6.0 | 101.02 | -0.1 |
**GNMA 30 yr**
| Coupon | Price | Intra-Day Change |
| 5.0 | 96.69 | -0.18 |
| 5.5 | 99.18 | -0.17 |
| 6.0 | 101.26 | -0.12 |
**Treasuries**
| Term | Yield | Price | Intra-Day Yield Change |
| 2 yr | 4.371 | 99.534 | 0.028 |
| 3 yr | 4.436 | 99.482 | 0.034 |
| 5 yr | 4.533 | 99.302 | 0.026 |
| 7 yr | 4.647 | 99.128 | 0.033 |
| 10 yr | 4.78 | 98.783 | 0.027 |
| 30 yr | 5.263 | 97.924 | 0.018 |