**WTMS Blog Today = What’s up in Mortgage Today (PM) – 08/25/2026**
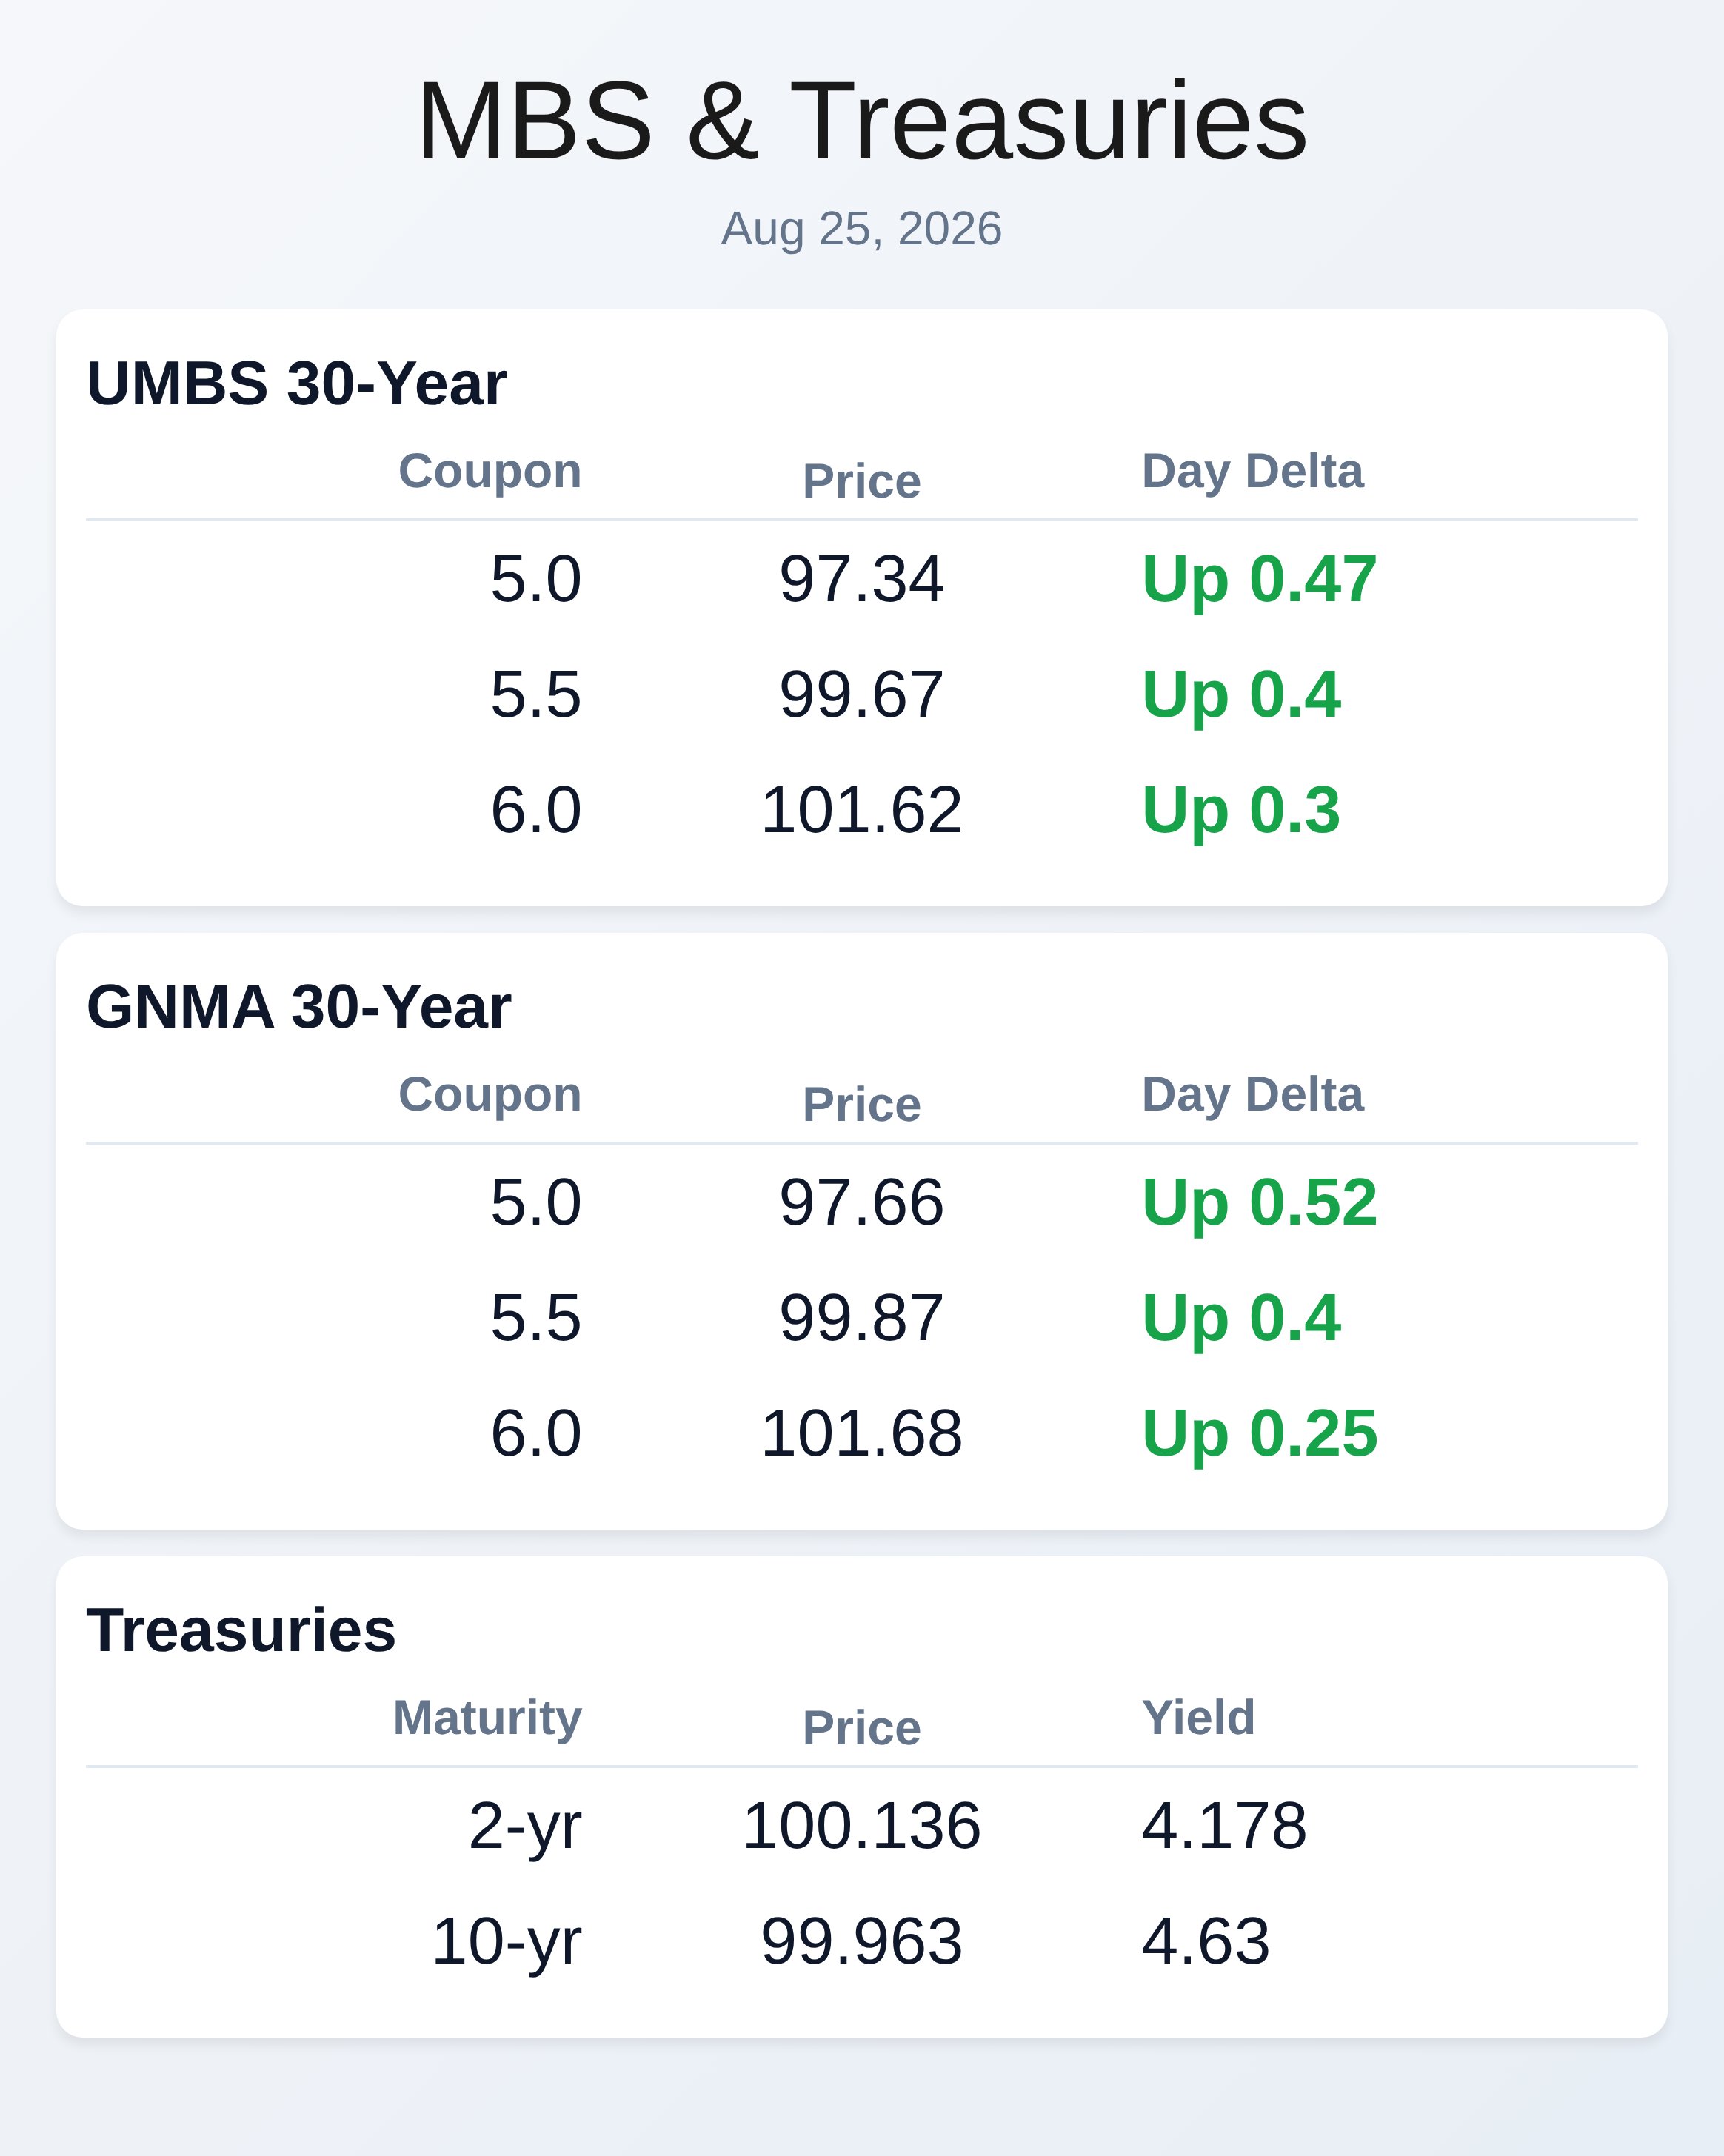
Bond markets rallied sharply today on hopes of a peace deal in the Iran conflict, with mortgage-backed securities and Treasury yields both posting significant gains. The 10-year yield dropped 6.5 basis points to 4.632% by day’s end, while UMBS 5.5 coupons climbed 42 basis points to 99.69. Oil prices fell alongside bond yields, a sign that geopolitical tension eased enough to ease inflation concerns.
However, analysts warn this volatility remains driven primarily by war headlines and fuel costs rather than fundamental economic shifts. The rally should not overshadow the uncertainty ahead for mortgage originators. Home price data released today showed mixed signals that could shape lock-and-float decisions going forward.
The Case-Shiller 20-city index climbed 2.1% year-over-year, topping forecasts of 1.7%, while monthly momentum slowed to just 0.4%. FHFA home prices rose 2.3% annually but showed zero monthly change, disappointing the 0.2% monthly gain investors expected. These data suggest that while housing markets remain sticky on an annual basis, near-term price pressures are cooling.
For mortgage sellers, slower price growth could translate to reduced equity accessibility and softer purchase demand in coming months. Secretary Bessent’s Treasury bond buyback plan continues to provide a “put” under longer-dated Treasuries, compressing swap spreads to their tightest since February. The 30-year swap spread narrowed to record lows as traders recognize the government now has a permanent buyer at the long end of the curve.
Benchmark Treasury yields have drifted lower despite the plan’s initial controversy, suggesting markets are crediting the intervention with some effectiveness. Positioning data shows bullish tilts in long-bond options, with call volume surging relative to puts on long-maturity Treasury futures. This dynamic means any rally could attract fresh selling, but any sell-off may encounter institutional support.
A federal court ruled that a RESPA referral case against Veterans United Home Loans can proceed to discovery, putting referral compensation models industry-wide on notice. The judge declined to grant the lender’s motion to dismiss the core claim that a 35% real estate commission split improperly rewarded agents for keeping borrowers with Veterans United. While the ruling is not a finding of guilt, it signals that courts will scrutinize whether compensation paid for legitimate services or for steering borrowers.
This case means mortgage originators must review their own referral arrangements with real estate partners, title companies, and appraisers to ensure they satisfy RESPA’s brokerage safe harbor. Ambiguity between referral fees and kickbacks remains a significant compliance risk industry-wide. GNMA securities outperformed UMBS slightly on the day, with the 6.0 coupon up 25 basis points to 101.68 versus UMBS 6.0 up 30 basis points to 101.62.
Lower coupons showed similar relative strength, with GNMA 5.0 gaining 52 basis points compared to UMBS 5.0 up 47 basis points. The narrowing differential reflects typical patterns when risk-off sentiment drives flight-to-quality demand. Two-year Treasuries fell 5.8 basis points to 4.172%, while the 30-year dropped 7.0 basis points to 5.156%, indicating a modest flattening across the curve.
These moves support the view that today’s rally was driven by geopolitical relief rather than economic weakness expectations.
**Locking vs Floating**
Market technicians identified today as the first meaningful test of the prevailing downtrend that began in late July, with the 4.62% level serving as a key pivot point. Risk-takers typically monitor such moments for evidence of follow-through; a break below 4.62% would signal stronger conviction in the rally.
Risk-averse borrowers should treat days like this as tactical opportunities to lock, securing rates before momentum potentially reverses. However, both lock and float decisions remain heavily dependent on daily headlines involving military conflict and oil prices rather than economic fundamentals. Support and resistance levels in the 10-year sit at 4.54%, 4.42%, 4.71%, and 4.80%, providing markers for technical traders.
**Today’s Events**
Case Shiller Home Prices-20 y/y (Jun): 2.1% vs 1.7% forecast, 1.6% previous
CaseShiller 20 mm nsa (Jun): 0.4% vs forecast not provided, 0.9% previous
FHFA Home Price Index m/m (Jun): 0.0% vs 0.2% forecast, 0.3% previous
FHFA Home Prices y/y (Jun): 2.3% vs forecast not provided, 2.2% previous
**Bond Pricing**
**UMBS 30 yr**
| Coupon | Price | Intra-Day Change |
**GNMA 30 yr**
| Coupon | Price | Intra-Day Change |
**Treasuries**
| Term | Yield | Price | Intra-Day Yield Change |
| 2 yr | 4.178 | 100.136 | -0.058 |
| 3 yr | 4.241 | 100.025 | -0.062 |
| 5 yr | 4.332 | 100.193 | -0.072 |
| 7 yr | 4.463 | 99.475 | -0.072 |
| 10 yr | 4.630 | 99.963 | -0.068 |
| 30 yr | 5.167 | 99.369 | -0.058 |