**WTMS Blog Today = What’s up in Mortgage Today (AM) – 08/25/2026**
MBS securities strengthened modestly Tuesday morning with UMBS 5.5 pricing at 99.47, up 0.20 from the previous close, while GNMA 5.5 held at 99.69, both tracking the softer Treasury backdrop. Oil prices dropped below $90 per barrel, providing relief to bond markets as diplomatic signals from the U.S. eased geopolitical tension concerns.
The 10-year Treasury yield declined 3.1 basis points to 4.66%, contributing to the modest upward pressure in agency mortgage-backed securities. Longer-dated maturities outperformed shorter durations, suggesting the market is pricing in some yield relief despite persistent deficit pressures. These intraday moves remain constrained within a narrow range, reflecting the uncertainty surrounding Fed policy and economic fundamentals.
Originators face continued bifurcation in the housing market, where monthly payment affordability—not down payment size—now determines whether borrowers can compete for ownership. Homeowners sitting on near-record equity levels remain reluctant to access it at rates pushing 7%, forcing lenders to focus on high-equity-position borrowers and innovative financing solutions. Millennials are adapting through smaller homes, lower-cost metros, and shared-equity structures rather than waiting for rates to fall.
This structural shift means originators must recalibrate their underwriting to emphasize cash flow sustainability and non-traditional income sources. Home equity lines of credit have emerged as the immediate volume driver, with smart lenders cutting closings from 45 days to 15 days through technology and streamlined processing. The employment picture remains resilient with private payrolls averaging 11,750 per week through August 8, though traders are waiting for clarity on whether the Fed will tighten further in September.
Federal Reserve Chair Kevin Warsh is set to deliver his first major speech this week, signaling potential shifts in communication style and monetary policy messaging. Technology earnings, particularly Nvidia, will weigh heavily on risk sentiment heading into September. Corporate bond issuance continues to exert upward pressure on long-end yields despite Treasury buyback programs.
The treasury market faces sustained pressure from widening deficits and a structural shift toward leveraged private investors replacing central banks as buyers. Case Shiller home prices posted a 2.1% year-over-year gain in June, beating expectations of 1.7% and up from 1.6% previously, signaling continued but moderating home price momentum. Month-over-month, the index rose just 0.4% versus forecast of flat readings, reflecting slower sequential appreciation.
FHFA’s housing price index showed a flat monthly reading in June, missing expectations of a 0.2% gain, while year-over-year growth ticked up to 2.3% from 2.2%. These mixed signals suggest home prices are stabilizing but not accelerating, reducing refinance urgency and keeping purchase activity dependent on employment stability. Lock-float considerations remain elevated given geopolitical uncertainty and commodity volatility, favoring a defensive posture until clearer momentum emerges.
**Locking vs Floating**
Lock-float risk remains elevated as each day brings new uncertainty around global conflict escalation and fuel price trajectories, combined with ongoing corporate bond issuance pressuring yields higher. Until a confirmed downtrend and clear support level emerges, lenders should maintain a defensive stance rather than chase short-term pockets of opportunity. Momentum indicators have yet to show a sustainable shift that would justify abandoning caution.
**Today’s Events**
Case Shiller Home Prices-20 y/y (Jun): 2.1% vs 1.7% forecast, 1.6% previous
CaseShiller 20 mm nsa (Jun): 0.4% vs forecast unavailable, 0.9% previous
FHFA Home Price Index m/m (Jun): 0.0% vs 0.2% forecast, 0.3% previous
FHFA Home Prices y/y (Jun): 2.3% vs forecast unavailable, 2.2% previous
July New Home Sales, August Consumer Confidence, $69 billion 2-year Treasury auction, and remarks from Richmond Fed President Barkin are also expected.
**Bond Pricing**
**UMBS 30 yr**
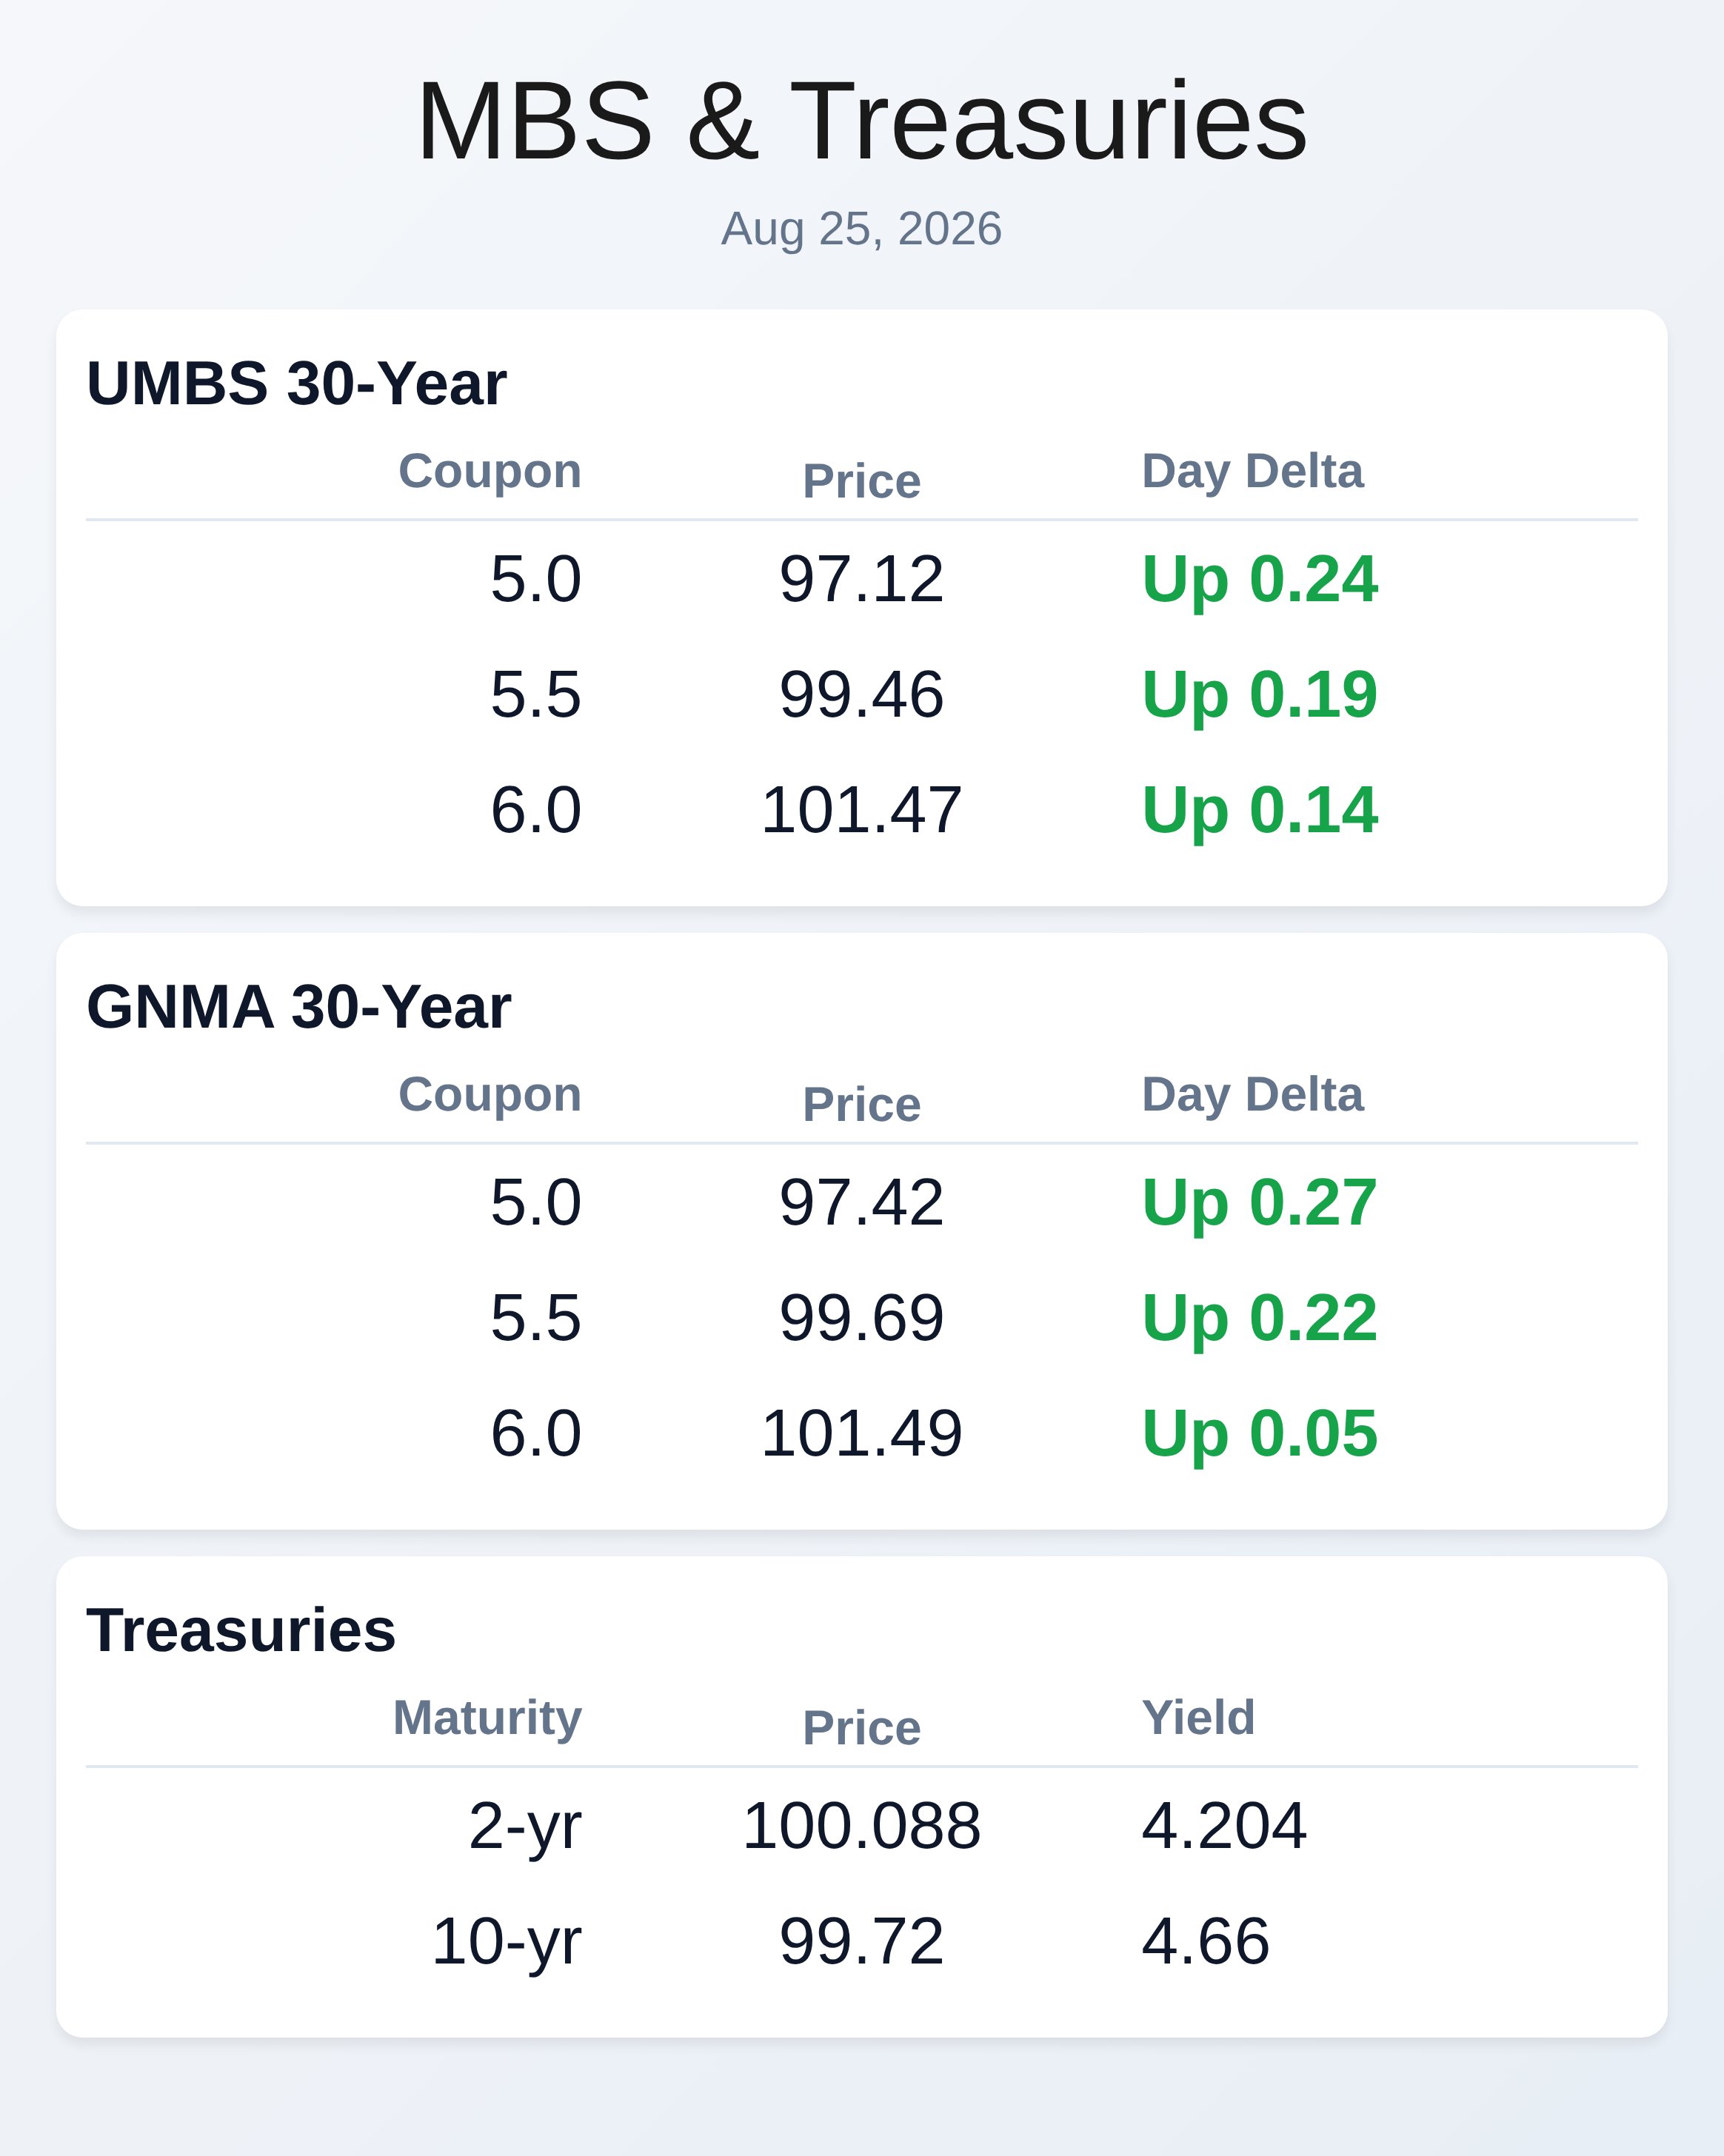
| Coupon | Price | Intra-Day Change |
| 5.0 | 97.12 | 0.24 |
| 5.5 | 99.46 | 0.19 |
| 6.0 | 101.47 | 0.14 |
**GNMA 30 yr**
| Coupon | Price | Intra-Day Change |
| 5.0 | 97.42 | 0.27 |
| 5.5 | 99.69 | 0.22 |
| 6.0 | 101.49 | 0.05 |
**Treasuries**
| Term | Yield | Price | Intra-Day Yield Change |
| 2 yr | 4.204 | 100.088 | -0.019 |
| 3 yr | 4.268 | 99.95 | -0.033 |
| 5 yr | 4.364 | 100.049 | -0.040 |
| 7 yr | 4.496 | 99.282 | -0.039 |
| 10 yr | 4.66 | 99.72 | -0.036 |
| 30 yr | 5.194 | 98.963 | -0.033 |