WTMS Blog Today = What’s up in Mortgage Today (AM) – 05/12/2026
Mortgage-backed securities retreated from morning highs as geopolitical tensions overshadowed April’s surprisingly hot inflation data. The 30-year UMBS 5.0 coupon fell nearly 0.17 points by mid-morning while the 10-year Treasury yield climbed 4.3 basis points to 4.451%, signaling investor anxiety about the Strait of Hormuz closure and rising energy costs. Core inflation printed 2.8% annually versus 2.7% forecasts, and headline CPI reached 3.8% year-over-year, the fastest pace since May 2023, yet bonds initially shrugged off the hotter-than-expected numbers.
Traders shifted focus to core goods deflation and housing sector weakness as reasons to believe rate cuts remain off the table for now. For lenders, this intraday volatility means overnight price protection is now critical, and most shops did not reprice before MBS peaked at 8:45 to 9:00 AM ET. Energy inflation is the real culprit driving Treasury yields higher, not domestic demand.
With oil climbing above $101 per barrel and shipping through the Strait of Hormuz nearly halted by the Iran conflict, commodity prices threaten to spill into future core inflation readings and derail any near-term rate relief. The supercore inflation metric (which excludes food, energy, and housing) remains stubbornly elevated at 3.32% annually, making the Federal Reserve reluctant to hint at easing. War-related headline risk now dominates bond market direction more than employment data, unemployment figures, or even the $42 billion 10-year Treasury auction scheduled for today.
Mortgage originators should expect rate sheet adjustments to move higher, particularly for overnight locks and weekend locks. Longer-dated rate certainty depends more on geopolitical developments than Fed policy at this moment. Optimal Blue’s April Market Advantage report reveals purchase demand weakening despite year-over-year strength.
Total rate-lock volume declined 9% month-over-month, though it remained 11% higher than April 2025, while purchase demand dipped less than 2% from March but stands up over 9% year-over-year. Refinance activity collapsed nearly 38%, compressing refi share to just 23% of total production, a clear signal that higher rates have suppressed legacy lending activity. Agency MBS share of secondary production rose to 44% as higher rates reduced refinance expectations, yet mortgage servicing rights values climbed on the same expectation.
The spring homebuying season is failing to deliver historically typical volume increases, with war costs and rising oil prices weighing on borrower psychology and purchase power.
**Locking vs Floating**
Bonds remain range-bound between 4.34% and recent highs, with no clear directional trigger in sight until geopolitical tensions ease or a peace deal emerges. Short-term lock-float strategies cannot reliably be set based on war headlines alone; the next meaningful move depends entirely on whether the Strait of Hormuz reopens.
Longer-term, a peace agreement would likely offer some rate benefit versus current levels, though energy inflation already baked into commodity markets may persist for months. Lenders should communicate to loan officers that repricing risk is elevated and overnight price protection is essential given the volatility.
**Today’s Events**
April m/m Headline CPI: 0.6% (forecast 0.6%, prior 0.9%)
April m/m CORE CPI: 0.4% (forecast 0.3%, prior 0.2%)
April y/y Headline CPI: 3.8% (forecast 3.7%, prior 3.3%)
April y/y CORE CPI: 2.8% (forecast 2.7%, prior 2.6%)
10-Year Treasury Note Auction: $42 billion
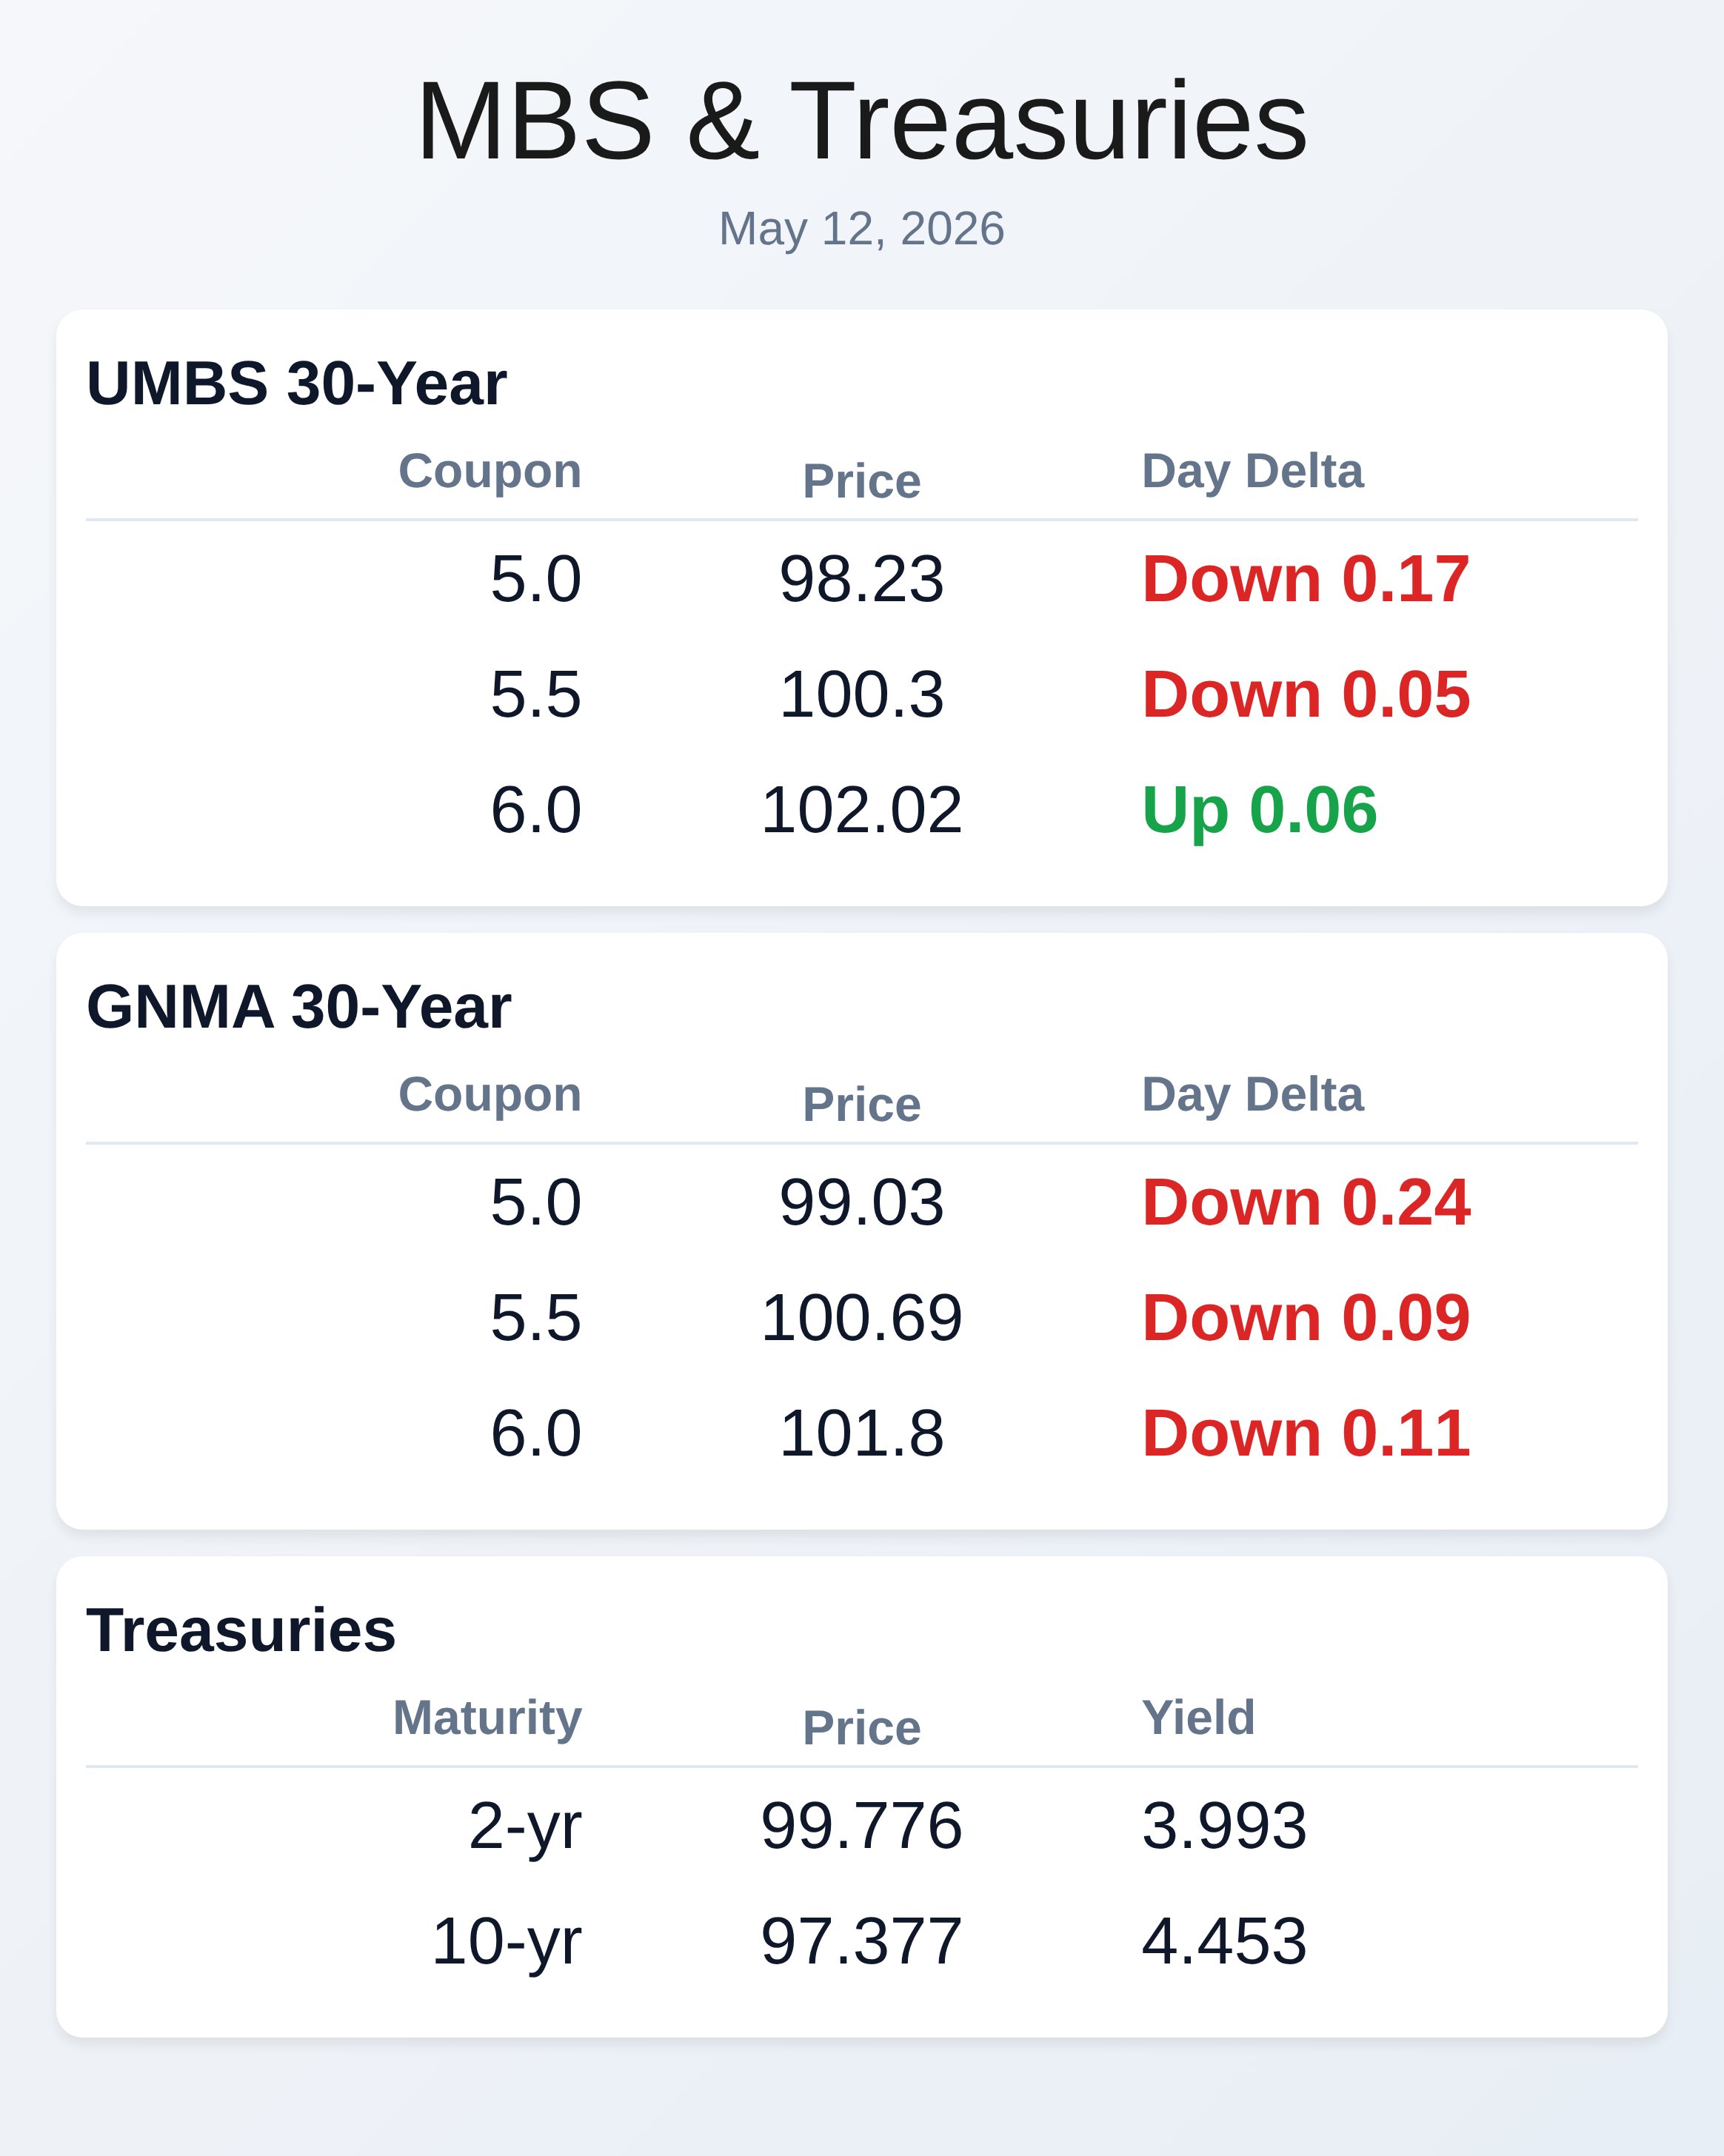
**Bond Pricing**
**UMBS 30 yr**
| Coupon | Price | Intra-Day Change |
| 5.0 | 98.23 | -0.17 |
| 5.5 | 100.3 | -0.05 |
| 6.0 | 102.02 | 0.06 |
**GNMA 30 yr**
| Coupon | Price | Intra-Day Change |
| 5.0 | 99.03 | -0.24 |
| 5.5 | 100.69 | -0.09 |
| 6.0 | 101.8 | -0.11 |
**Treasuries**
| Term | Yield | Price | Intra-Day Yield Change |
| 2 yr | 3.993 | 99.776 | 0.041 |
| 3 yr | 4.02 | 98.544 | 0.045 |
| 5 yr | 4.117 | 98.916 | 0.043 |
| 7 yr | 4.284 | 99.797 | 0.042 |
| 10 yr | 4.453 | 97.377 | 0.044 |
| 30 yr | 5.018 | 95.868 | 0.031 |