**WTMS Blog Today = What’s up in Mortgage Today (AM) – 07/14/2026**
June inflation data delivered a bombshell this morning, with the consumer price index falling 0.4% month-over-month—the first decline since 2020—and core CPI flat at 0.0% versus expectations for 0.2% growth. This sharply better-than-expected report instantly propelled bond markets higher, sending 10-year Treasury yields down over 7 basis points and UMBS securities up more than 3/8ths of a point by midday. The 30-year UMBS 5.5 coupon jumped to 99.73, up 0.33 from the previous close, while year-over-year readings improved to 3.5% headline and 2.6% core—both below forecasts.
Supercore inflation, which excludes housing costs, posted its first negative reading in over a year at -0.2%, a crucial sign that underlying price pressures are cooling. Market participants immediately reassessed Federal Reserve rate-hike odds downward, recognizing that this inflation trajectory reduces pressure on the central bank to tighten further. GNMA 30-year securities mirrored the rally, with the 5.5 coupon trading at 100.27, up 0.28 from yesterday’s close, as mortgage investors shifted capital into agency mortgage-backed securities.
The broader Treasury curve responded with short-end yields declining more sharply than longer maturities, reflecting the market’s recalibration of near-term Fed policy expectations. Two-year Treasury yields dropped 8.5 basis points to 4.19%, while the 10-year settled around 4.57% after opening at 4.61% yesterday. This steepening in the yield curve benefits mortgage originators by improving the spread between wholesale funding costs and retail mortgage pricing.
The benign inflation print also temporarily overshadowed earlier geopolitical concerns about Middle East tensions and rising oil prices, allowing markets to focus on the underlying economic fundamentals. Mortgage originators should recognize that today’s CPI relief opens a brief window for competitive rate locks before market sentiment shifts again. Floating borrowers who held through recent weakness now face a difficult decision: locking in near-term gains or gambling on further Fed rate cuts.
The sharp intraday rally in MBS pricing suggests that higher-coupon pools offer better value than lower coupons currently, as investors pay down principal and refinancing convexity improves. Correspondents and wholesale lenders will likely tighten pricing by 50 to 75 basis points on conforming and jumbo products within hours, so originating teams should move quickly to capitalize on improved margins. This is not a time to hesitate; inflation surprises of this magnitude can reverse just as fast as they arrive.
**Locking vs Floating**
After months of asymmetric floating risk, today’s inflation print handed floating borrowers a genuine relief rally. The market’s rapid repricing lower suggests that further Fed rate hikes are off the table in the near term, removing one of the primary risks that had made floating loans dangerous. However, geopolitical tensions remain elevated, and oil prices continue to climb, meaning another supply shock could easily reverse today’s gains.
Lock-friendly borrowers should act decisively, as this window of favorable repricing will not remain open for long. Floating borrowers who stay in the market beyond this afternoon are essentially betting that inflation will remain under control despite ongoing Middle East disruptions and elevated oil prices above $80 per barrel.
**Today’s Events**
m/m CORE CPI (Jun): 0.0% vs 0.2% forecast, 0.2% previous
m/m Headline CPI (Jun): -0.4% vs -0.1% forecast, 0.5% previous
y/y CORE CPI (Jun): 2.6% vs 2.8% forecast, 2.9% previous
y/y Headline CPI (Jun): 3.5% vs 3.8% forecast, 4.2% previous
**Bond Pricing**
**UMBS 30 yr**
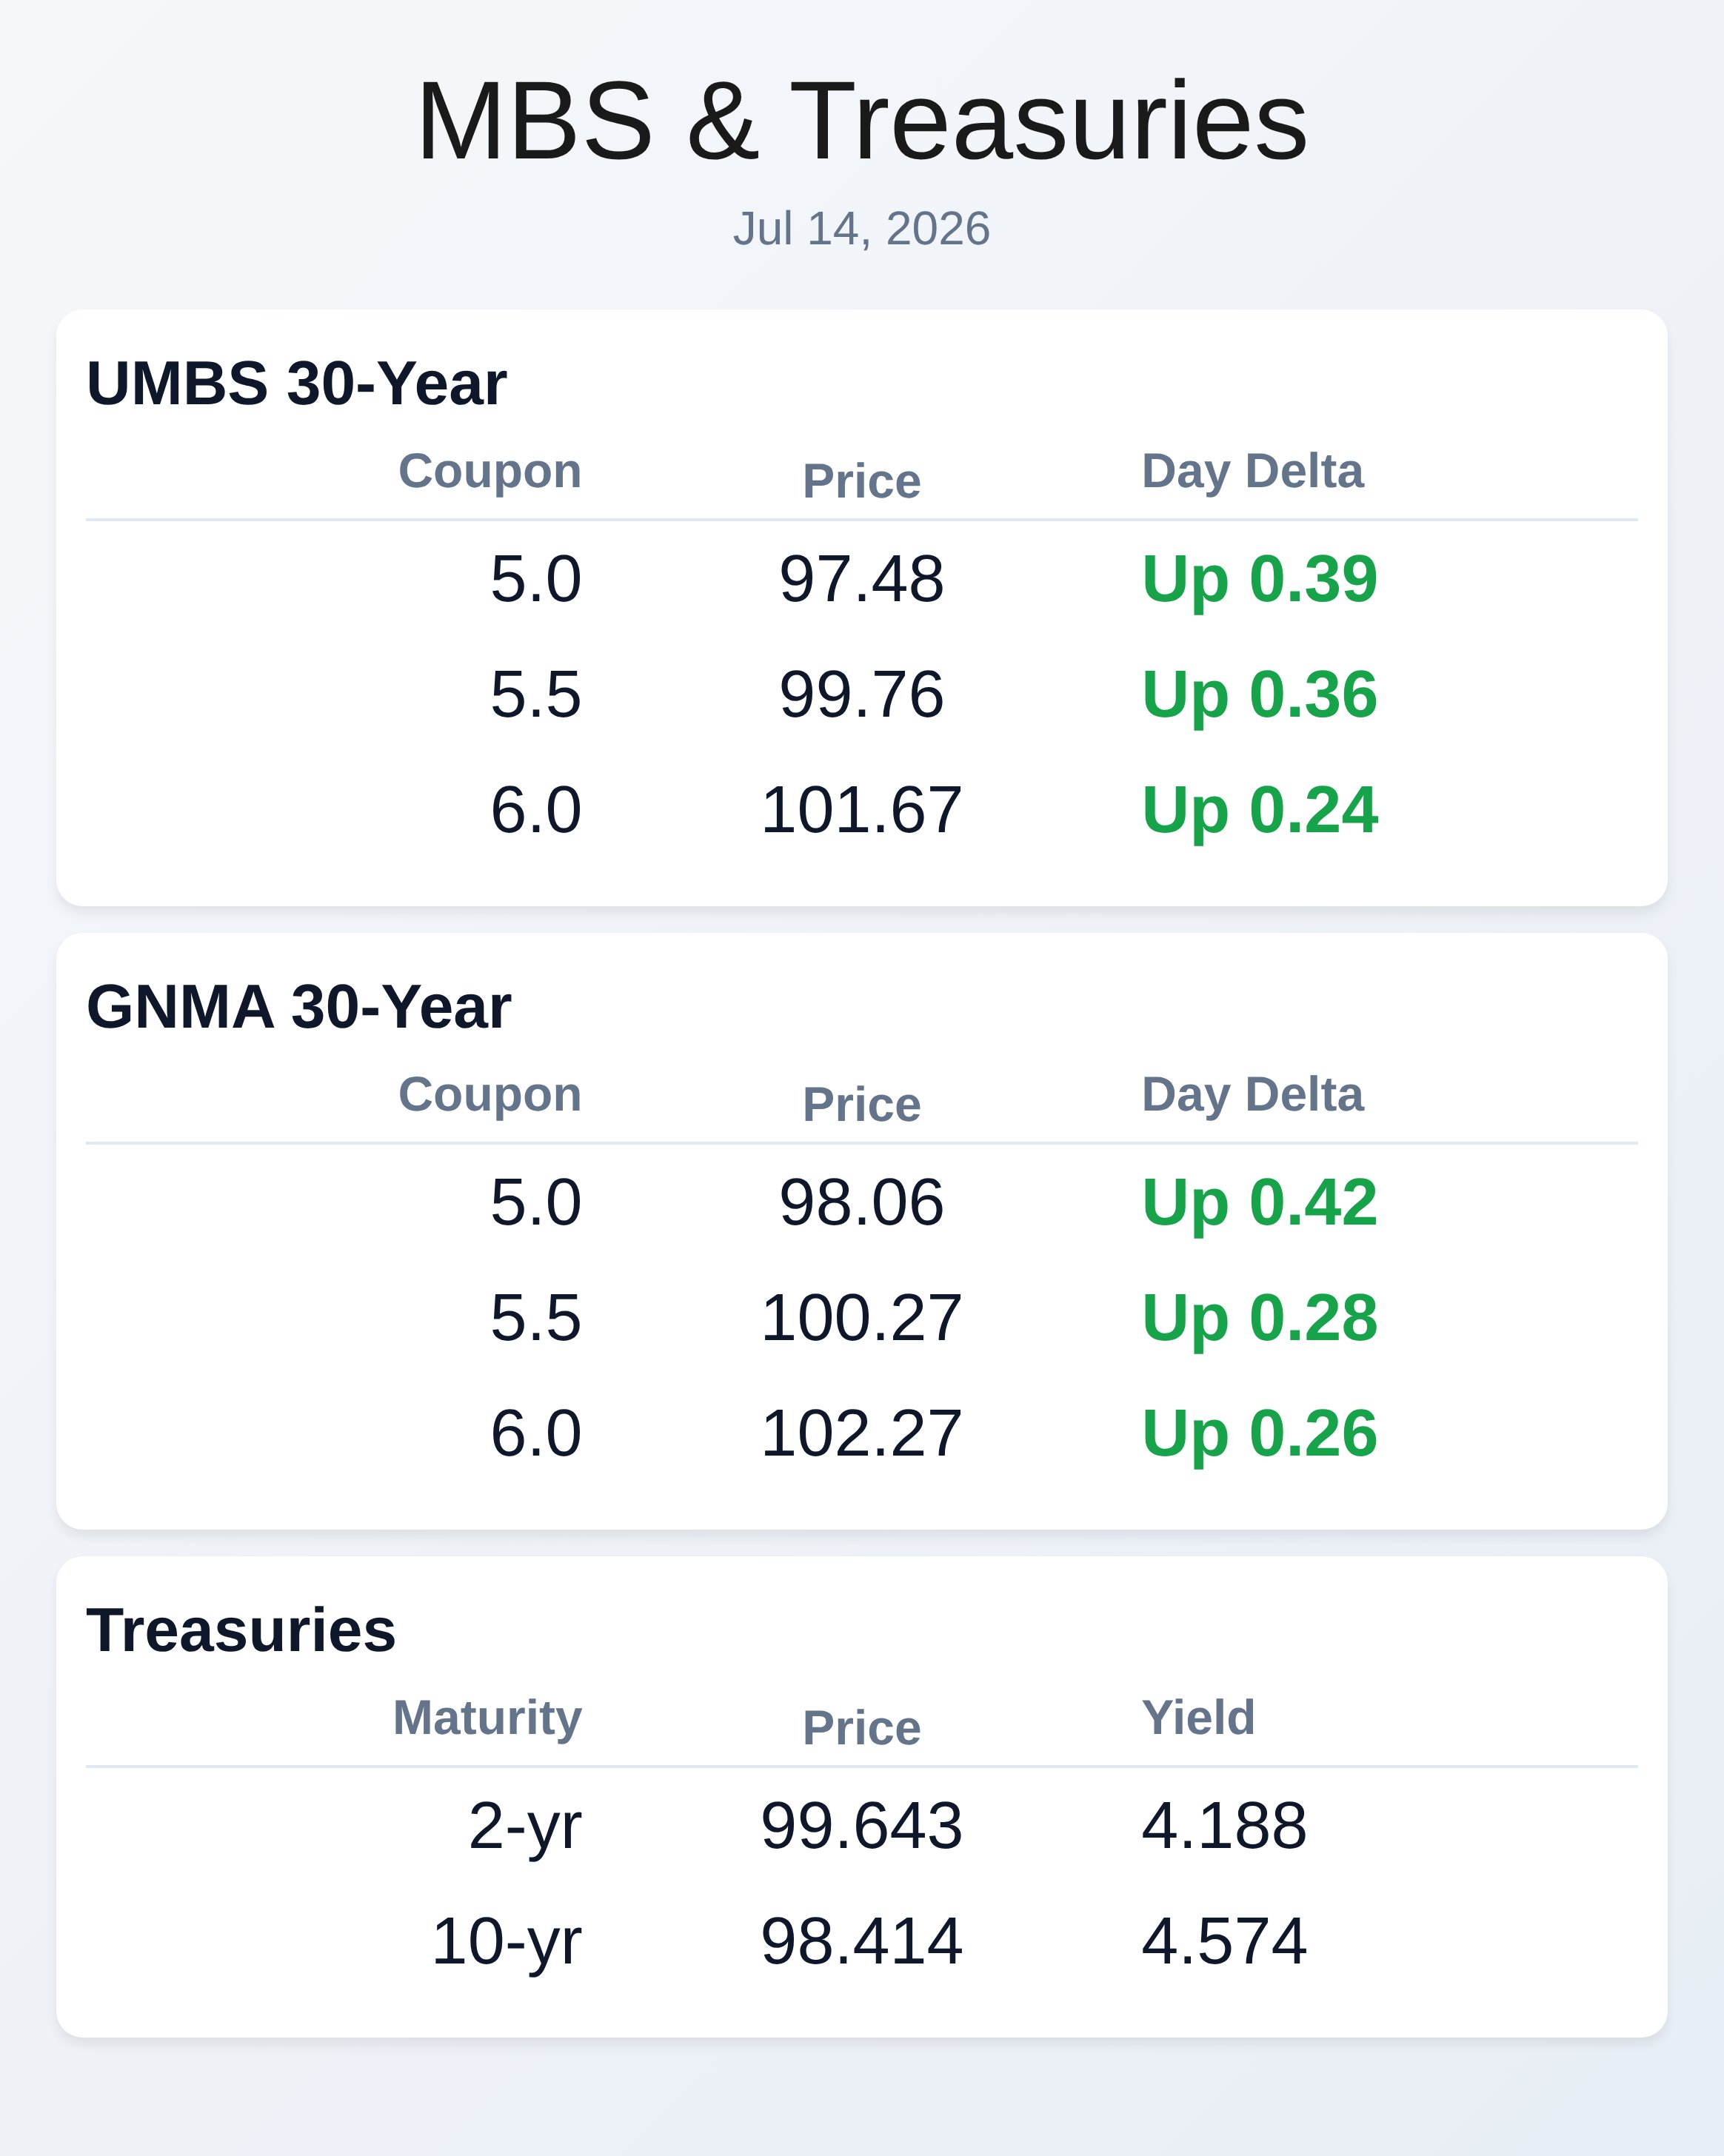
| Coupon | Price | Intra-Day Change |
| 5.0 | 97.48 | 0.39 |
| 5.5 | 99.76 | 0.36 |
| 6.0 | 101.67 | 0.24 |
**GNMA 30 yr**
| Coupon | Price | Intra-Day Change |
| 5.0 | 98.06 | 0.42 |
| 5.5 | 100.27 | 0.28 |
| 6.0 | 102.27 | 0.26 |
**Treasuries**
| Term | Yield | Price | Intra-Day Yield Change |
| 2 yr | 4.188 | 99.643 | -0.085 |
| 10 yr | 4.574 | 98.414 | -0.041 |
| 30 yr | 5.089 | 98.637 | -0.018 |