**WTMS Blog Today = What’s up in Mortgage Today (AM) – 07/15/2026**
Producer prices fell 0.3% month-over-month in June, crushing expectations for flat readings and igniting a rally in bonds across the board. The June headline PPI decline was driven entirely by energy prices, which plunged 5.7% as gasoline cooled significantly post-Iran conflict escalation. Core PPI, the inflation metric that excludes food and energy volatility, posted just 0.2% monthly growth versus the 0.3% forecast, signaling genuine deceleration in underlying price pressures.
Notably, revisions to prior months brought annual PPI down a full percentage point—from 6.0% previously reported to 5.5% today—offering markets a much softer inflation narrative. This data triggered Fed Funds Futures improvements and Treasury yields broadly lower, with the 10-year falling 1.4 basis points to 4.574% by mid-morning. UMBS and GNMA securities posted solid morning gains on the back of softer inflation signals and improved technical positioning.
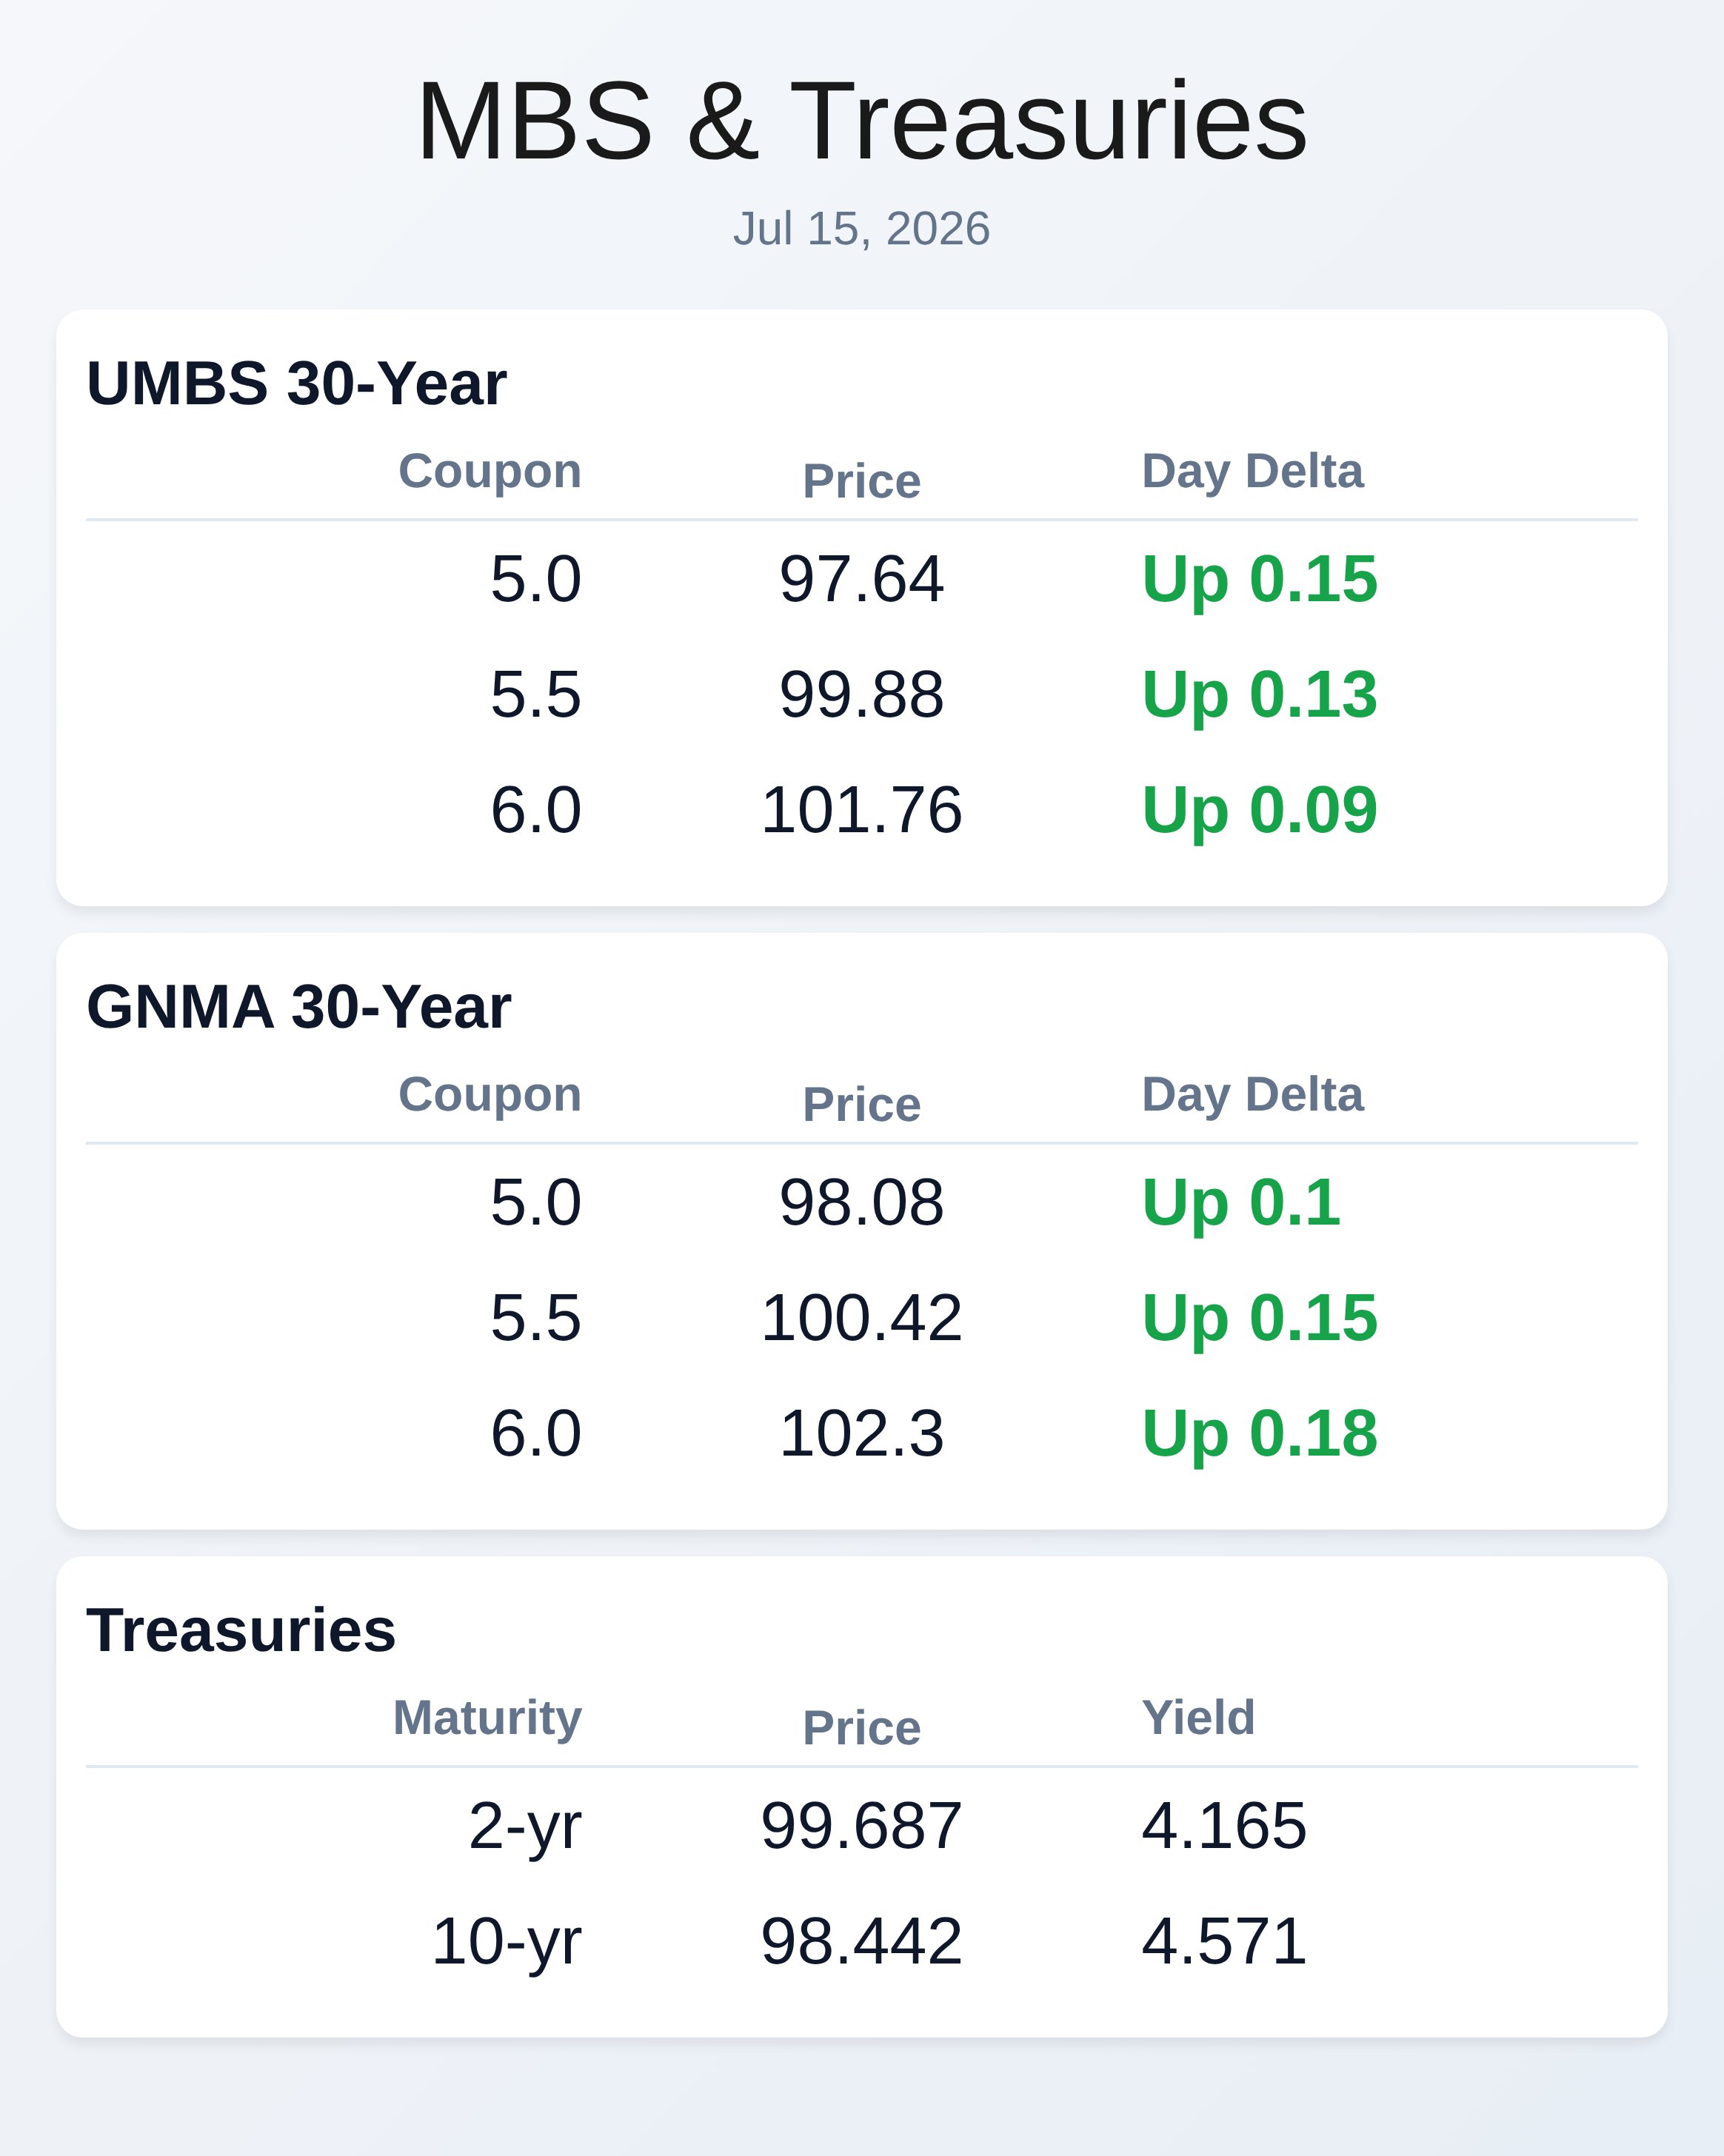
The 5.5 UMBS coupon jumped 13–15 basis points, landing near 99.88, while comparable GNMA 5.5 securities traded around 100.42, also up substantially. Lower coupons like 5.0 UMBS showed gains of 15 basis points to 97.64, with GNMA 5.0 up 10 basis points to 98.08. These moves suggest investors are rotating back into agency mortgage securities as refinancing expectations shift lower on the back of declining rate prospects.
Higher coupons including 6.0 UMBS and GNMA 6.0 also posted gains, though at a more modest 9–18 basis points, reflecting typical convexity mechanics in a rallying bond market. The broader Treasury complex weakened late morning as geopolitical tensions and oil price resilience tempered the initial enthusiasm from soft inflation data. The 10-year Treasury yield had climbed back above 4.61% by noon, giving back much of the morning’s 1.4 basis point decline, while the 2-year yield sat around 4.165%, down only 3.6 basis points from Tuesday’s close.
Shorter-dated yields benefited more from the PPI print than longer tenors, a pattern consistent with Fed rate-cut expectations concentrated in the nearer term. The 30-year yield fell just 0.7 basis points, underscoring investor concern about medium-term fiscal and geopolitical headwinds that could sustain inflation and limit the Fed’s ability to cut rates aggressively. Mortgage application activity rolled over again, with the Mortgage Bankers Association reporting a 2.7% decline in weekly submissions as the 30-year fixed rate climbed to 6.65%—its highest level since August 2025.
Purchase applications fell 7% seasonally adjusted, reflecting ongoing affordability strain on borrowers, though refinance activity ticked up 4% week-over-week on hopes for future rate declines. The combination of elevated mortgage rates and constrained housing affordability continues to weigh on origination volumes, signaling that yesterday’s CPI surprise and today’s PPI beat have not yet moved the needle enough to unlock pent-up demand. Lenders remain focused on top-of-funnel borrower acquisition as purchase-driven originations contract.
Demographic shifts are reshaping the mortgage industry’s long-term playbook, according to a Mortgage Bankers Association white paper that warns household formation will slow as populations age and birth rates remain below replacement levels. Rather than pursuing a business model built on endless home price appreciation and rising purchase volume, lenders must now pivot toward operational efficiency, market share consolidation, and engaging borrowers earlier in their homeownership lifecycles. Some regional markets will continue facing supply constraints while others experience inventory growth that outpaces demand, requiring tailored origination strategies.
The Fed’s balance sheet runoff continues at a measured pace, with Agency MBS holdings declining $17.7 billion in June—the fastest monthly decrease in a year—but prepayment risks remain low given elevated mortgage rates that discourage refinancing activity. Fed Chair Kevin Warsh testified before the Senate Banking Committee on Wednesday, reaffirming the central bank’s commitment to price stability and maximum employment while offering few immediate policy surprises. The testimony underscored that future Fed decisions will be guided by inflation data and work from newly established policy task forces reviewing communication, balance sheet strategy, and analytical tools.
Markets are pricing a lower probability of a rate hike later this month following Tuesday’s CPI surprise, though September expectations remain elevated pending further inflation signals. Oil prices continue to pose upside risk to the disinflationary narrative, having risen for three straight days on renewed Middle East tensions, and any sustained surge above $85 a barrel could derail mortgage gains and force lenders to lock positions defensively.
**Locking vs Floating**
The PPI print was softer than expected, particularly the monthly decline of 0.3% and downward revisions to prior months, which supports near-term bond rallies and floating-rate positions.
However, energy prices remain the wildcard—fuel surges tied to Iran tensions could quickly erase today’s gains, making floating increasingly risky unless oil stabilizes below $80 a barrel. Borrowers locking in the 6.5% range are protecting against upside inflation surprises, while those floating are betting that the Fed’s rate trajectory has genuinely shifted dovish, a wager that depends on sustained disinflation.
**Today’s Events**
– 8:30 AM: Core PPI m/m (Jun) — Actual: 0.2% vs.
Forecast: 0.3% vs. Prior: 0.1%
– 8:30 AM: Core PPI y/y (Jun) — Actual: 4.7% vs. Forecast: 5.2% vs.
Prior: 4.6%
– 8:30 AM: PPI m/m (Jun) — Actual: -0.3% vs. Forecast: 0.0% vs. Prior: 1.1%
– 8:30 AM: PPI y/y (Jun) — Actual: 5.5% vs.
Forecast: 6.2% vs. Prior: 6.0%
– 10:00 AM: Fed Chair Kevin Warsh Testimony to Senate Banking Committee
**Bond Pricing**
**UMBS 30 yr**
| Coupon | Price | Intra-Day Change |
| 5.0 | 97.64 | 0.15 |
| 5.5 | 99.88 | 0.13 |
| 6.0 | 101.76 | 0.09 |
**GNMA 30 yr**
| Coupon | Price | Intra-Day Change |
| 5.0 | 98.08 | 0.1 |
| 5.5 | 100.42 | 0.15 |
| 6.0 | 102.3 | 0.18 |
**Treasuries**
| Term | Yield | Price | Intra-Day Yield Change |
| 2 yr | 4.165 | 99.687 | -0.036 |
| 3 yr | 4.213 | 99.754 | -0.034 |
| 5 yr | 4.29 | 99.265 | -0.035 |
| 7 yr | 4.424 | 98.965 | -0.028 |
| 10 yr | 4.571 | 98.442 | -0.018 |
| 30 yr | 5.095 | 98.543 | -0.007 |