**WTMS Blog Today = What’s up in Mortgage Today (AM) – 05/28/2026**
Geopolitical tensions in the Middle East are pushing bonds around like a yo-yo, with Iran hostilities knocking mortgage-backed securities down over an eighth of a point this morning while the 10-year Treasury yield ticked up to 4.507%. Markets are caught between hope for a lasting peace deal and fear of oil-driven stagflation, creating a volatile backdrop where MBS prices swing on headlines rather than fundamentals. The Trump administration continues airstrikes while signaling a potential agreement may take several more days, keeping investors in a holding pattern.
For originators, this geopolitical noise means lock-in conversations should emphasize rate protection now rather than waiting for clarity that may not come soon. Lenders watching their margins know that basis points lost to volatility don’t come back. First-quarter GDP came in revised down to 1.6% from the advance estimate of 2.0%, falling short of the 2.0% consensus forecast and signaling economic momentum is cooling faster than expected.
Personal consumption weakened to 1.4% from 1.6%, and the core PCE price index rose 4.4% quarterly—a meaningful miss on the inflation side that has the Federal Reserve increasingly concerned. This data snapshot shows an economy that is neither recession-bound nor firing on all cylinders, which removes near-term rate cut expectations and strengthens the “higher-for-longer” narrative gaining traction in fixed income markets. Mortgage originators should prepare borrowers for rates staying elevated through the second half of 2026.
The Fed’s preference for staying patient rather than aggressively tightening policy is now conditional on inflation data staying cooperative. Core inflation metrics arrived mixed this morning, with April core PCE rising 0.2% month-over-month and 3.3% year-over-year—both meeting expectations—while headline PCE climbed 3.8% year-over-year as expected. Energy price spikes tied to Middle East escalation are pushing oil above $97 a barrel and threatening to reignite inflation in non-energy sectors if the conflict drags on.
April durable goods orders surged 7.9% month-over-month, well above the 3.5% forecast, showing consumers remain willing to spend despite price pressures. Jobless claims came in at 215,000 versus the 211,000 forecast, indicating labor market softening at the margins but no collapse. These cross-currents mean the Fed faces a tightrope walk: inflation may not be as tamed as hoped, yet growth is decelerating.
Treasury bond auctions yesterday showed mixed demand, with the 5-year note auction yielding 4.18% and attracting bid-to-cover of 2.34x—in line with historical averages but unspectacular. Foreign buyers remained cautious, taking only 75% of the indirect allotment, while direct bidders pulled back sharply, forcing dealers to absorb more supply than usual. This weakness in auction demand suggests investors are still nervous about committing duration in an uncertain geopolitical environment, preferring to wait for a clearer picture before deploying capital.
The real test comes today with the 7-year note auction and a $500 million TIPS buyback. For mortgage market liquidity, auction stress ripples quickly into MBS pricing and secondary market execution. Bond technical momentum has turned supportive, though the rally faces headwinds from persistent inflation concerns and a Federal Reserve now openly discussing the possibility of rate hikes by year-end rather than cuts.
The 10-year Treasury yield retreated more than 20 basis points from last week’s highs, helped by month-end fund repositioning and demand for duration, but absent a major economic deterioration or decisive de-escalation in the Middle East, the move may struggle to extend materially. Investors are watching Fed speakers closely—especially traditionally dovish members—to see if the committee is truly comfortable holding rates steady indefinitely or if the door to tightening is reopening. For loan officers, this means rate lock windows may not stay open much longer if inflation fears resurface.
The message is simple: rates above 4.5% on the 10-year may not be available for much longer once peace headlines fade. The mortgage origination playbook is shifting as refinance volume dries up and lenders must squeeze every basis point from margins to stay profitable. Manual pricing engines and legacy loan-commit workflows are becoming cost anchors in a business where speed and precision determine survival, with some lenders capturing two to five incremental basis points by automating secondary market execution.
Artificial intelligence is reshaping how lenders engage borrowers, raising new questions about whether technology enhances or replaces trust in the customer relationship. Lenders that can move pricing and execution into real-time automated workflows while maintaining borrower confidence are positioning themselves to thrive in a slower, lower-margin origination environment. For smaller lenders and brokers, this is a call to invest now in modern systems or risk being priced out of the market.
**Locking vs Floating**
Borrowers face continued elevated continued claims, mixed inflation signals, and geopolitical headline risk that is likely to keep rates volatile through month-end. The economic data shows growth cooling and inflation sticky, pushing the Federal Reserve closer to an extended pause or even future rate hikes, which removes any near-term rate decline scenario from the table. Lock decisions should prioritize certainty over waiting, especially as Middle East tensions could reignite oil-driven inflation at any moment.
**Today’s Events**
Continued Claims (May 16): 1,786.0K vs. 1,780K forecast
Core CapEx (April): -1.1% vs. 0.4% forecast
Core PCE month-over-month (April): 0.2% vs.
0.3% forecast
Core PCE year-over-year (April): 3.3% vs. 3.3% forecast (met expectations)
Core PCE Prices Q1: 4.4% vs. 4.3% forecast
Corporate Profits Q1: -0.4% vs.
5.7% forecast
Durable Goods Orders (April): 7.9% vs. 3.5% forecast
GDP Q1: 1.6% vs. 2.0% forecast (revised down)
GDP Final Sales Q1: 1.5% vs.
1.6% forecast
Jobless Claims (May 23): 215.0K vs. 211K forecast
PCE year-over-year (April): 3.8% vs. 3.8% forecast (met expectations)
PCE prices month-over-month (April): 0.4% vs.
0.5% forecast
**Bond Pricing**
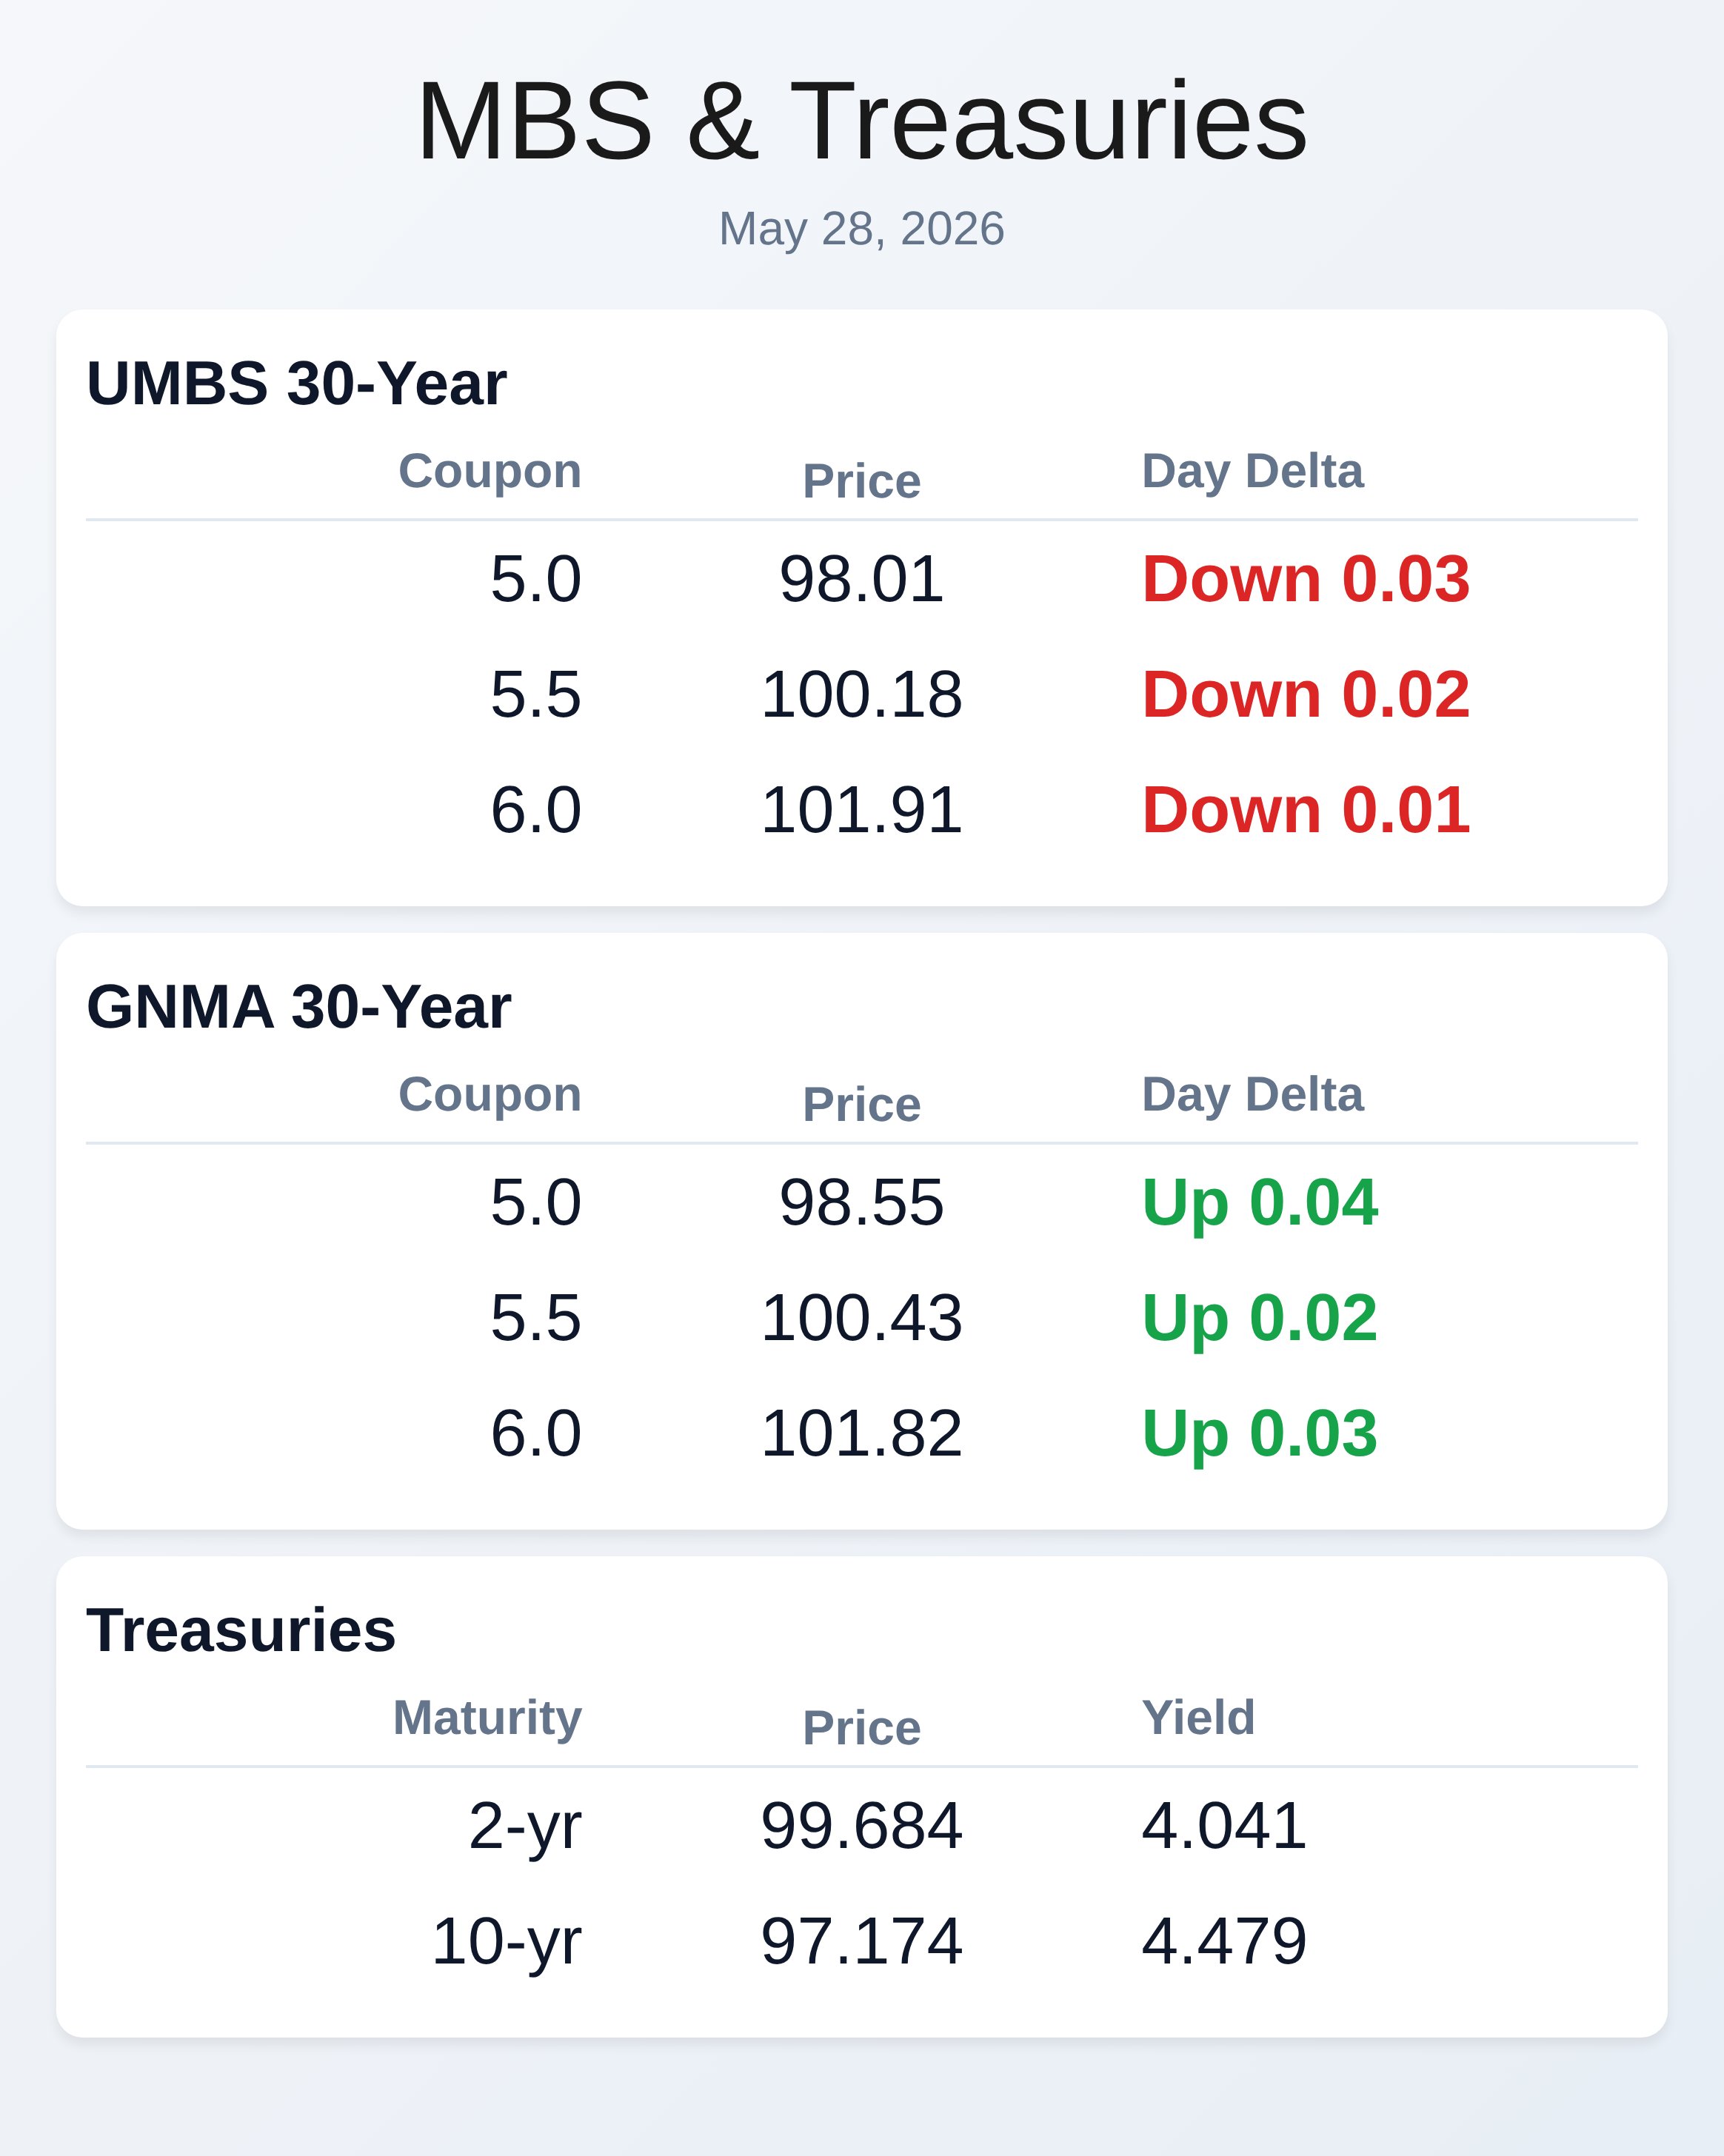
**UMBS 30 yr**
| Coupon | Price | Intra-Day Change |
| 5.0 | 98.01 | -0.03 |
| 5.5 | 100.18 | -0.02 |
| 6.0 | 101.91 | -0.01 |
**GNMA 30 yr**
| Coupon | Price | Intra-Day Change |
**Treasuries**
| Term | Yield | Price | Intra-Day Yield Change |
**GNMA 30 Year**
| Coupon | Price | Intra-Day Change |
|—:|—:|—:|
| 5.0 | 98.55 | 0.04 |
| 5.5 | 100.43 | 0.02 |
| 6.0 | 101.82 | 0.03 |
**Treasuries**
| Term | Yield | Price | Intra-Day Yield Change |
|—|—:|—:|—:|
| 2 yr | 4.041 | 99.684 | 0.008 |
| 3 yr | 4.091 | 98.348 | 0.007 |
| 5 yr | 4.183 | 98.625 | 0.004 |
| 7 yr | 4.318 | 99.592 | -0.007 |
| 10 yr | 4.479 | 97.174 | -0.005 |
| 30 yr | 5.003 | 96.085 | -0.01 |
Subscribe free to Well That Makes Sense at WellThatMakesSense.com for daily mortgage market intelligence delivered to your inbox.