**WTMS Blog Today = What’s up in Mortgage Today (AM) – 05/29/2026**
War headlines continue to dominate bond markets, but geopolitical swings are creating opportunities for lenders as oil prices retreat below $90 per barrel. Mortgage bankers posted their strongest production in four years during Q1 2026, with refinance activity rebounding and cost discipline finally showing bottom-line results. The Mortgage Bankers Association data shows the industry is on track for its second consecutive profitable year after right-sizing operations for realistic production volumes.
However, rising foreclosures—up 26 percent year-over-year in Q1 to roughly 119,000—signal homeowner stress from soaring insurance, property taxes, and homeowner association fees. Meanwhile, existing housing inventory is rising while sales remain flat, pushing months-of-inventory higher and creating downward pressure on home prices that may not recover inflation losses anytime soon. Markets are pricing in the possibility of additional Fed rate hikes if inflation proves persistent, though most officials still expect disinflation to resume without further tightening.
The recent rise in Treasury yields appears driven less by inflation itself and more by stronger real economic activity, higher neutral rate estimates, and rising term premiums. Personal income growth stalled in April, business investment showed weakness, and first-quarter GDP was revised lower, yet resilient consumption and a steady labor market continue to support the economic narrative. Treasury buying accelerated yesterday after meaningful progress reports on Iran ceasefire negotiations drove oil back below $90, reinforcing bond demand across all tenors.
A strong 7-year Treasury auction marked the first stop-through in that duration since December, evidence that investors still have appetite for duration despite geopolitical volatility. The key question for mortgage originators is whether consumers can absorb higher energy and food costs without reducing spending materially. Wholesale inventories came in at 0.5 percent versus a 0.8 percent forecast and 1.3 percent prior reading, adding to the slowdown narrative.
Chicago PMI for May and additional Fed speeches arrive later today, continuing a busy economic calendar that will test bond market conviction. Bonds remain transfixed by war-related headlines and are surprisingly receptive regardless of news quality, suggesting there is room to rally if peace becomes official but also room to sell if negotiations falter. The clear takeaway is that positioning remains uncertain—investors are waiting for clarity rather than making bold directional bets.
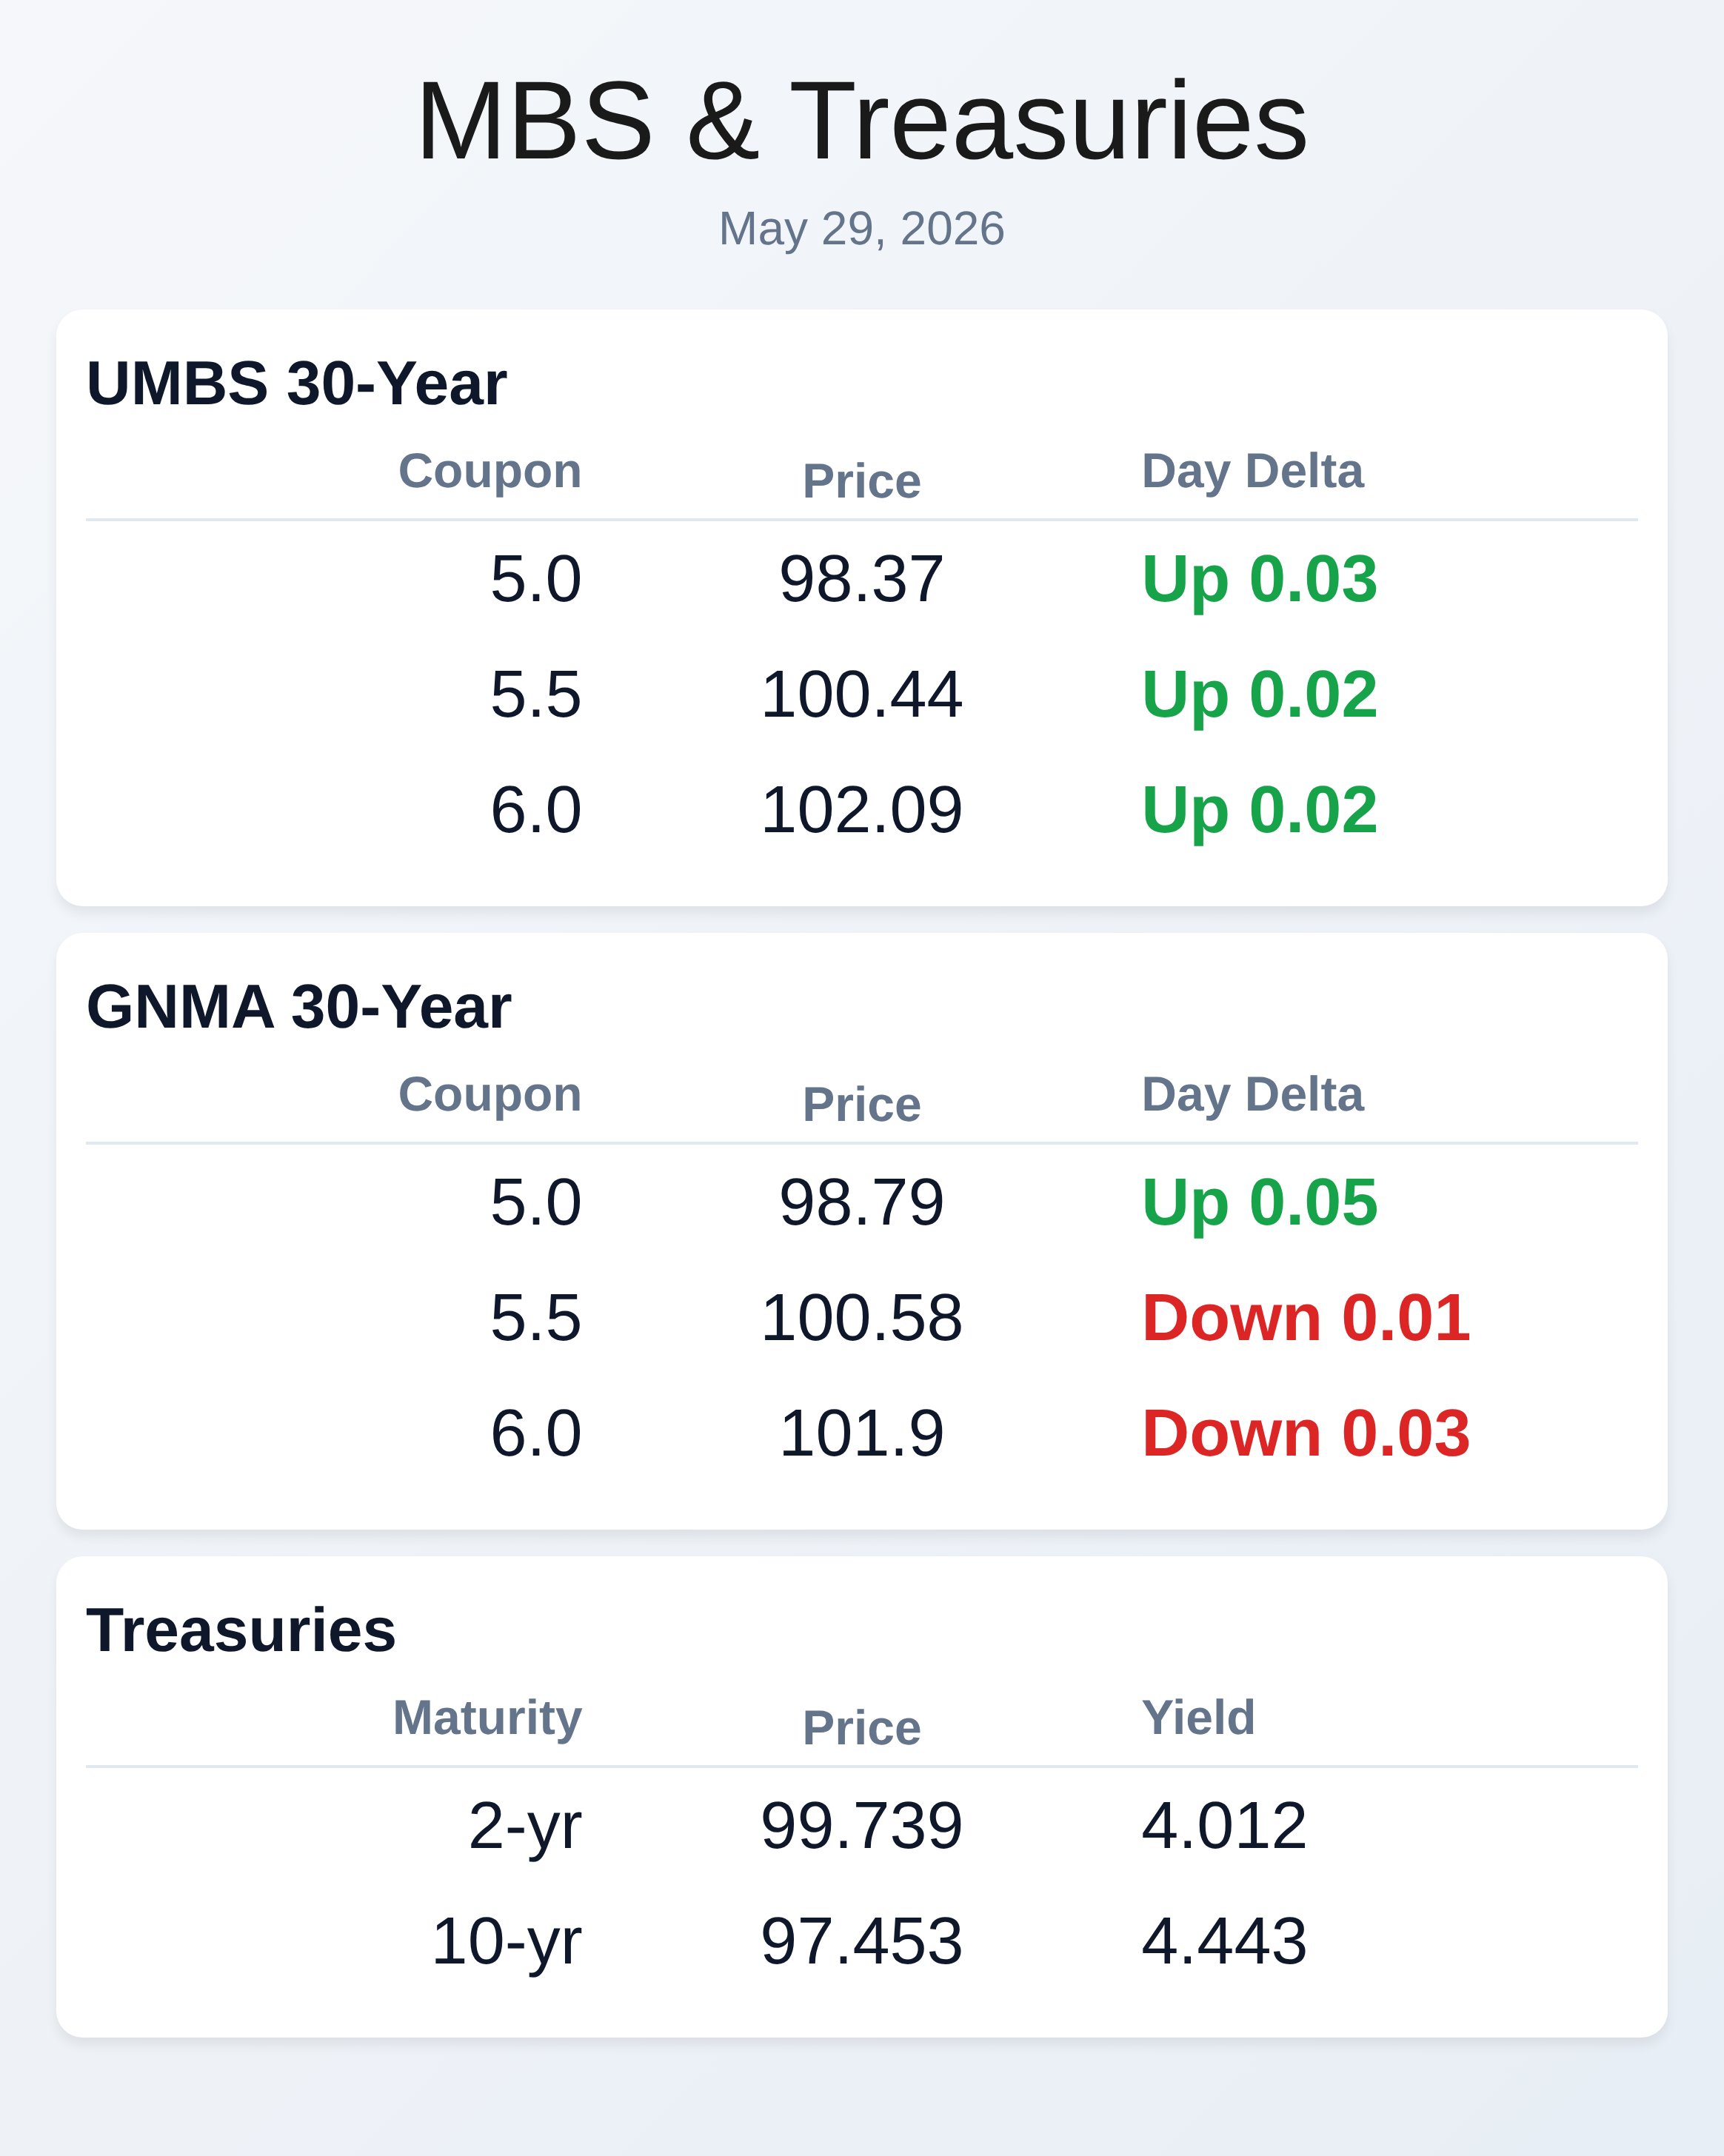
For mortgage sellers, this environment requires sharp hedge discipline and careful pipeline risk management. MBS prices have ticked slightly higher this morning, with 5.0 coupons up 3 basis points intraday and 10-year yields holding flat around 4.44 percent. Capital markets costs remain elevated but improving execution requires access to multiple dealer platforms; lenders relying on only four dealers consistently miss 3 basis points on average across executions.
The message is clear: lenders investing in operational excellence, technology, and product diversification are outpacing competitors facing legacy constraints.
**Locking vs Floating**
Bonds remain transfixed by war headlines and are responsive to any ceasefire or escalation news regardless of economic merit. There is room to rally if peace becomes official, but room to sell if the peace process falters.
Lock strategically when headlines favor de-escalation; float cautiously when military tensions spike or negotiations stall, as oil volatility will drive repricing quickly.
**Today’s Events**
Wholesale Inventories: 0.5 percent versus 0.8 percent forecast, 1.3 percent prior
Chicago PMI for May
Multiple Federal Reserve speeches scheduled
**Bond Pricing**
**UMBS 30 yr**
| Coupon | Price | Intra-Day Change |
| 5.0 | 98.37 | 0.03 |
| 5.5 | 100.44 | 0.02 |
| 6.0 | 102.09 | 0.02 |
**GNMA 30 yr**
| Coupon | Price | Intra-Day Change |
| 5.0 | 98.79 | 0.05 |
| 5.5 | 100.58 | -0.01 |
| 6.0 | 101.9 | -0.03 |
**Treasuries**
| Term | Yield | Price | Intra-Day Yield Change |
| 2yr | 4.012 | 99.739 | -0.011 |
| 3yr | 4.06 | 98.433 | -0.011 |
| 5yr | 4.145 | 98.794 | -0.013 |
| 7yr | 4.285 | 99.789 | -0.009 |
| 10yr | 4.443 | 97.453 | -0.001 |
| 30yr | 4.978 | 96.474 | -0.001 |