**WTMS Blog Today = What’s up in Mortgage Today (AM) – 07/16/2026**
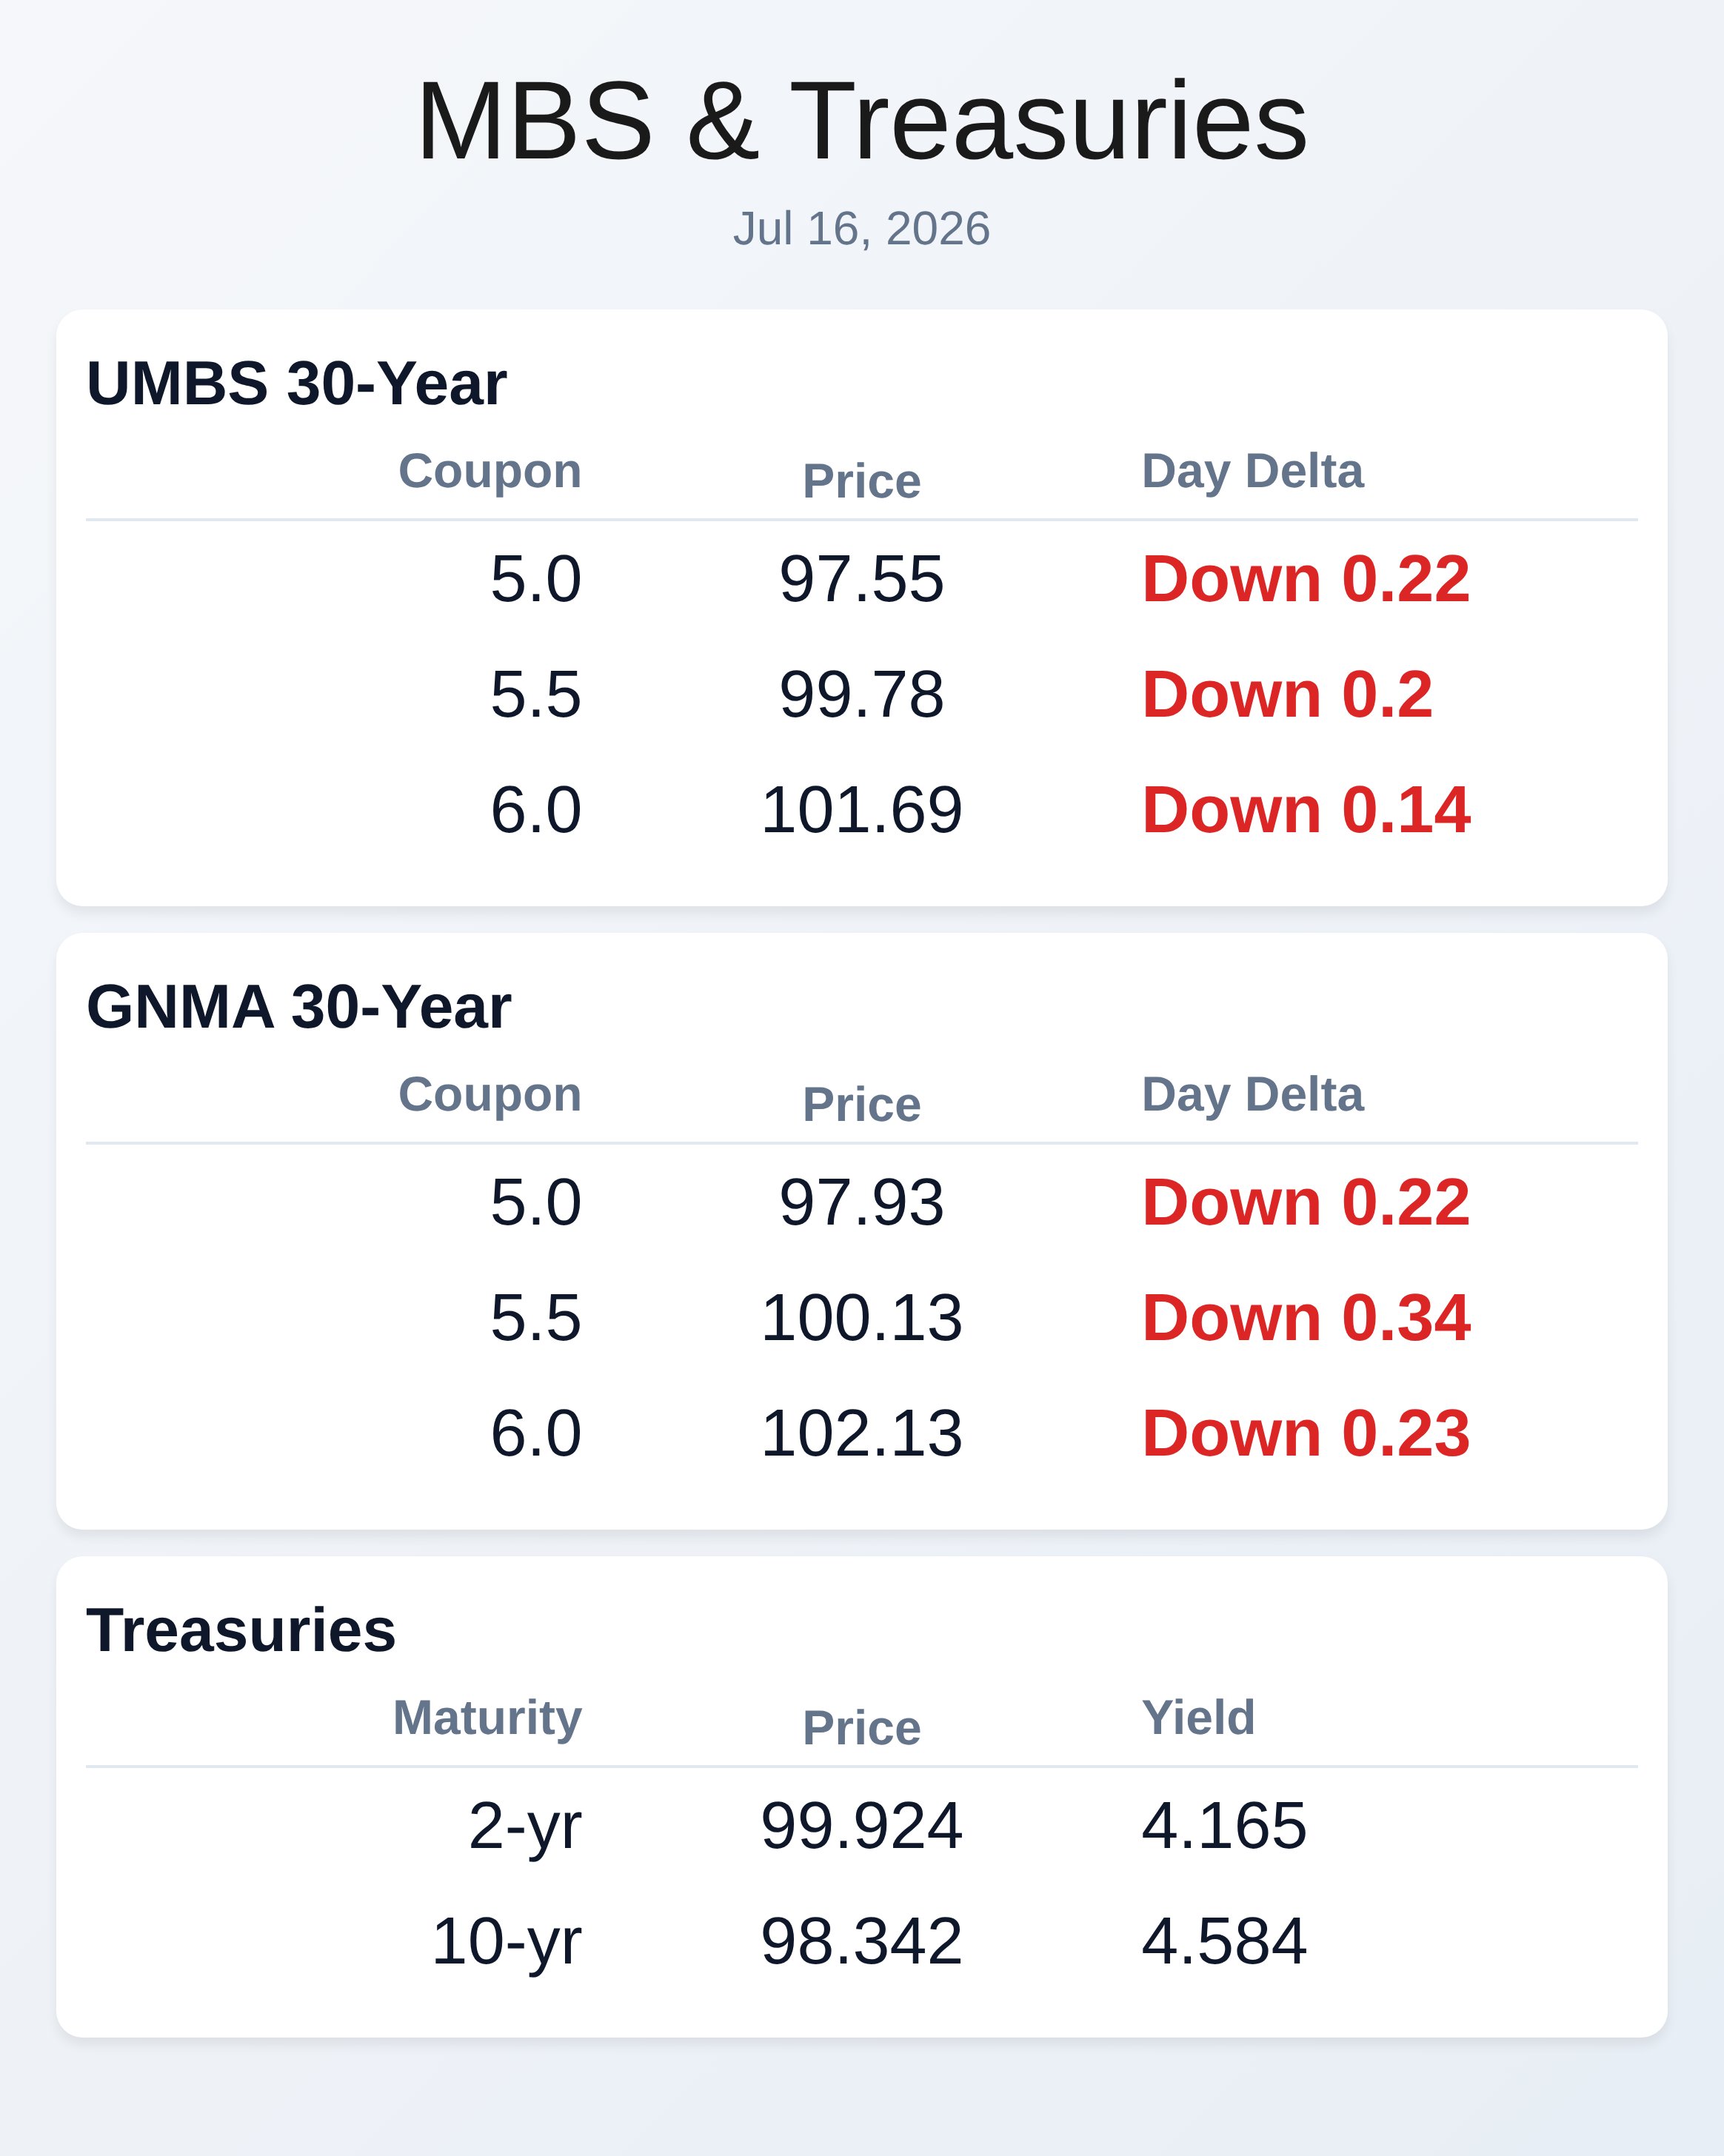
MBS securities took a hit this morning as bonds weakened overnight with the 10-year Treasury climbing 3.5 basis points to 4.586%, signaling cautious sentiment before new economic data. The 30-year UMBS 5.5 coupon slipped to 99.78, down 0.20 from Wednesday’s close, while GNMA 5.5 moved to 100.13, down 0.34 points in a softer market environment. Traders should note that yields are testing a critical resistance level at 4.54%—if this floor breaks, sentiment could shift materially lower for lenders.
The unusual weakness persists despite mostly favorable economic prints, suggesting the summer trading doldrums combined with profit-taking is tempering gains. Bid-ask spreads remain wider than normal, making it essential to shop rates aggressively rather than accept quoted levels passively. Mortgage credit availability tightened sharply in June to its lowest level of the year as lenders pulled back on FHA and VA streamline refinance products, especially for higher-risk borrowers.
Government-backed lending standards are now nearly 4 percent tighter than January and 46 percent below pre-pandemic levels, creating headwinds for borrowers with marginal credit profiles. However, this credit tightening is actually shifting production toward Ginnie Mae securities, whose share of Agency issuance has reached historic highs as borrowers increasingly depend on FHA and VA loans. For MBS investors, this changing mix carries portfolio implications—Ginnie Mae borrowers typically have lower credit scores and higher delinquency rates than conventional counterparts.
The trend reflects affordability pressures forcing marginal borrowers toward government programs despite stricter underwriting. Artificial intelligence is reshaping core mortgage operations beyond simple productivity, with the most promising applications now in voice automation, document intelligence, and pre-underwriting functions. Lenders deploying AI agents are automating up to 80 percent of repetitive underwriting tasks, cutting loan review times from roughly four hours to under one hour while freeing staff for high-judgment work.
Forward-thinking shops are connecting front and back-office workflows so AI can flag missing documentation and contact borrowers within minutes, significantly shrinking loan cycle times and improving borrower experience. Mortgage executives evaluating AI vendors should demand proven production deployments in complex regulatory scenarios, not just polished demos, while making data security and model governance non-negotiable. The real competitive edge will go to lenders willing to rethink workflows and use automation to enhance (not replace) human expertise.
Pricing execution continues to separate winners from laggards in a market where borrowers shop rate aggregators before ever calling a loan officer. American Federal Mortgage sustained a 25 basis point lift over best efforts for two consecutive years through disciplined pricing, hands-on advisory, and real-time execution—the same opportunity most lenders see moving from best efforts to mandatory pricing models. That execution margin funds marketing flexibility and pricing competitiveness, helping American Federal grow from $450 million toward a $600 million production target this year.
Ongoing pull-through monitoring keeps the desk informed on whether spreads are holding or eroding under volume pressure. For your shop, the lesson is clear: margin discipline today buys competitive flexibility tomorrow. The Federal Reserve signaled patience after Chair Warsh’s Senate testimony offered no new policy hints, leaving markets focused on incoming economic data like today’s Philadelphia Fed Index, jobless claims, and retail sales.
Weekly jobless claims printed at 208,000 (below the 217,000 forecast), confirming the job market remains solid despite recession chatter and softening elsewhere. The Philadelphia Fed Business Index surged to 41.4 from an expected 13, suggesting manufacturing sentiment swung sharply optimistic, though prices paid remained elevated at 53.90. Retail sales matched expectations at 0.2 percent, with the control group at 0.5 percent, indicating consumer spending remains resilient despite higher fuel costs and tariff uncertainty.
Later today brings NAHB Housing Index, Pending Home Sales, and comments from Dallas Fed President Logan and Vice Chair Jefferson—all potential rate movers heading into Friday’s final jobs report. Risk-tolerant lenders can use 4.61–4.62% as an overhead lock trigger based on today’s early gains, but exercise caution since yields failed to break yesterday’s post-data lows. A break below 4.54% would soften the near-term outlook and create fresh support for floaters, but yields remain stuck in a narrow, contested range.
The market’s seasonal illiquidity combined with profit-taking makes wider spreads the norm, so negotiate aggressively with multiple pricing sources and cultivate strong dealer relationships. Keep an eye on afternoon economic data and Fed speakers—any hawkish surprise could reignite bond weakness. By late July, summer trading doldrums will likely persist, so discipline and patience remain your best tools.
**Locking vs Floating**
Risk-tolerant clients have breathing room to lock mortgages around 4.61–4.62% based on today’s gains, but remain cautious since yesterday’s post-data lows proved to be resistance, not breakout levels. The 4.54% floor represents critical technical support; breaking below it would strengthen the outlook for floaters. Seasonal illiquidity and wide bid-ask spreads mean you should negotiate across multiple dealers rather than passively accepting quoted rates.
**Today’s Events**
Jobless Claims (Jul/11): 208K vs 217K forecast, 215K previous
Philly Fed Business Index (Jul): 41.4 vs 13 forecast, 10.3 previous
Philly Fed Prices Paid (Jul): 53.90 vs — forecast, 53.20 previous
Retail Sales (Jun): 0.2% vs 0.2% forecast, 0.9% previous
Retail Sales Control Group MoM (Jun): 0.5% vs 0.5% forecast, 0.7% previous
**Bond Pricing**
**UMBS 30 yr**
| Coupon | Price | Intra-Day Change |
**GNMA 30 yr**
| Coupon | Price | Intra-Day Change |
**Treasuries**
| Term | Yield | Price | Intra-Day Yield Change |
**UMBS 30 yr**
| Coupon | Price | Intra-Day Change |
|—:|—:|—:|
| 5.0 | 97.55 | -0.22 |
| 5.5 | 99.78 | -0.20 |
| 6.0 | 101.69 | -0.14 |
**GNMA 30 yr**
| Coupon | Price | Intra-Day Change |
|—:|—:|—:|
| 5.0 | 97.93 | -0.22 |
| 5.5 | 100.13 | -0.34 |
| 6.0 | 102.13 | -0.23 |
**Treasuries**
| Term | Yield | Price | Intra-Day Yield Change |
|—:|—:|—:|—:|
| 2 yr | 4.165 | 99.924 | 0.03 |
| 3 yr | 4.216 | 99.746 | 0.033 |
| 5 yr | 4.295 | 99.242 | 0.034 |
| 7 yr | 4.432 | 98.918 | 0.034 |
| 10 yr | 4.584 | 98.342 | 0.033 |
| 30 yr | 5.116 | 98.229 | 0.032 |
Subscribe free at WellThatMakesSense.com for daily mortgage market intelligence and strategy.