**WTMS Blog Today = What’s up in Mortgage Today (AM) – 09/24/2026**
Bonds suffered their worst selloff in weeks yesterday as yields spiked to 20-year highs across the curve, forcing mortgage rates upward and squeezing originator margins. The 10-year Treasury jumped 14 basis points to around 5.125 percent, while the 30-year approached 5.4 percent, dragging the FNCL conventional coupon up 19 basis points to 6.22 percent. Fast-money traders amplified long-end moves as the market repriced against Fed hawkishness and inflation concerns.
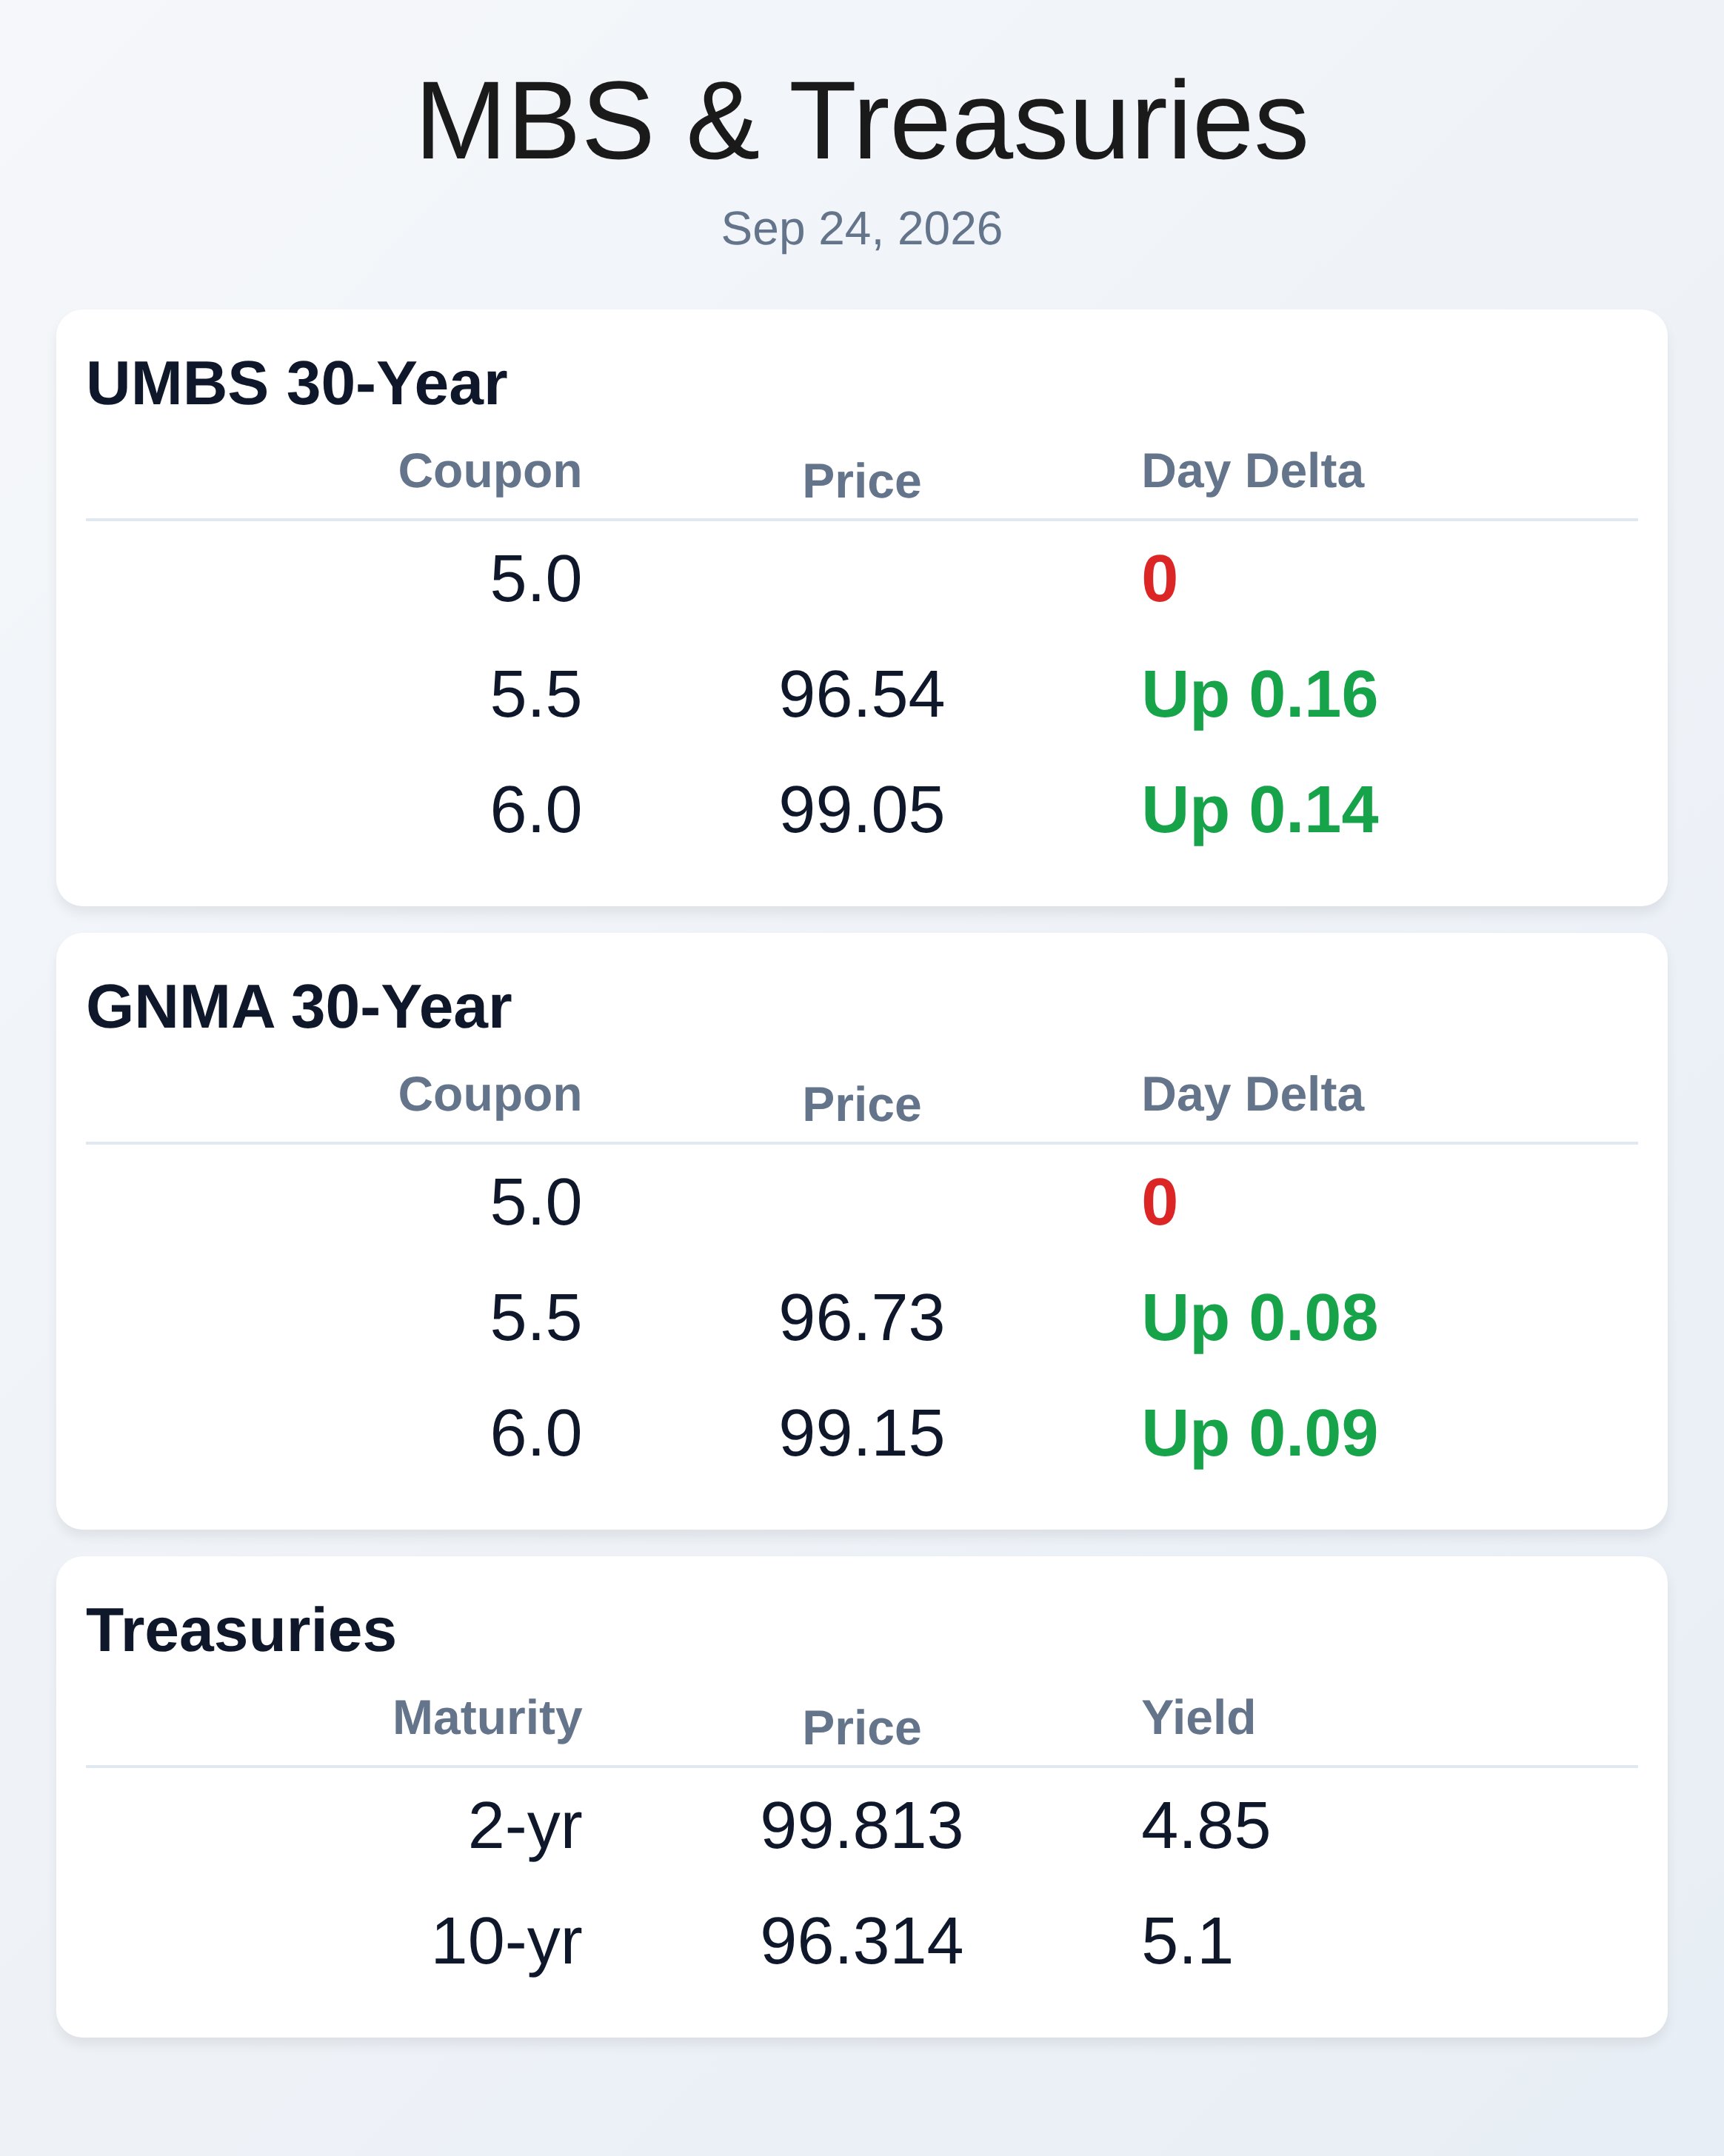
The par note rate climbed 15 basis points to a restrictive 7.125 percent, and the probability of an October rate hike surged to 70 percent. This morning, MBS gained 2 ticks while the 10-year backed down 1.9 basis points, but the damage is done and volatility remains elevated. The bond rout was driven by multiple factors converging simultaneously.
The preliminary September PMI reading showed a sharp acceleration in U.S. business activity to multi-year highs, stoking recession-prevention concerns and spurring expectations for further Fed tightening. Fed Governor Barr signaled hawkishly that his baseline includes additional policy adjustments, adding credibility to tightening bets.
A weak $70 billion 5-year Treasury auction cleared above 5.03 percent with a wide 3.1-basis point tail, revealing that foreign indirect bidders plummeted to just 54 percent. Crude oil futures rose again amid continued Middle East tensions, lifting inflation expectations across the board. Mortgage originators faced a brutal repricing session as spreads widened materially on light volume and rate locks came under pressure.
The sharp move in long-end yields hit the mortgage market harder than the short end, which reacted more logically to Fed catch-up tightening. A lender that locked loans yesterday morning faced serious pullback risk, and anyone floating into today’s session has to weigh whether prices stabilize or continue deteriorating. The broad-based selloff suggests market participants are genuinely worried about further Fed action and fiscal drag from the mounting budget deficit.
For now, the stance remains conservative: wait for a definitive rally before aggressively locking loan flow. The economic calendar is packed today, starting with jobless claims that came in right on forecast at 197,000. Continuing claims eased to 1.719 million versus expectations of 1.750 million, offering a small bit of good news on labor market softness.
Later today brings August new home sales, a $44 billion 7-year Treasury auction, and a $6 billion buyback operation in long-dated bonds. Fed speakers are scheduled, and there’s also a President Trump and President Xi meeting on the agenda, adding geopolitical uncertainty to an already nervous market. Any additional inflation prints or hawkish commentary could trigger another round of selling.
**Locking vs Floating**
The technical break above 5.01 percent on the 10-year is a clear warning sign, and there’s no telling whether the market will find a bid today or months from now. Until bonds show a definitive shift and rally, the prudent approach is to remain conservative with rate locks and avoid overcommitting to floating inventory. Nerves are running high ahead of next week’s economic data, and spreads have widened enough that many originators are pulling back on risk exposure.
The default stance since early July has not changed: do not become aggressive until you see a convincing rally.
**Today’s Events**
Jobless Claims (Sep/19): 197.0K vs 201K forecast, 196K previous
Continued Claims (Sep/12): 1,719K vs 1,750K forecast, 1,730K previous
August New Home Sales (later today)
$44 billion 7-year Treasury note auction (later today)
$6 billion Treasury buyback operation in 20-year to 30-year bonds (today)
Federal Reserve speakers (Fedspeak scheduled throughout the day)
President Trump and President Xi bilateral meeting
**Bond Pricing**
**UMBS 30 yr**
| Coupon | Price | Intra-Day Change |
**GNMA 30 yr**
| Coupon | Price | Intra-Day Change |
**Treasuries**
| Term | Yield | Price | Intra-Day Yield Change |
| 2yr | 4.85 | 99.813 | -0.047 |
| 3yr | 4.926 | 98.481 | -0.049 |
| 5yr | 4.971 | 100.129 | -0.023 |
| 7yr | 5.026 | 96.927 | -0.024 |
| 10yr | 5.1 | 96.314 | -0.012 |