**WTMS Blog Today = What’s up in Mortgage Today (AM) – 09/28/2026**
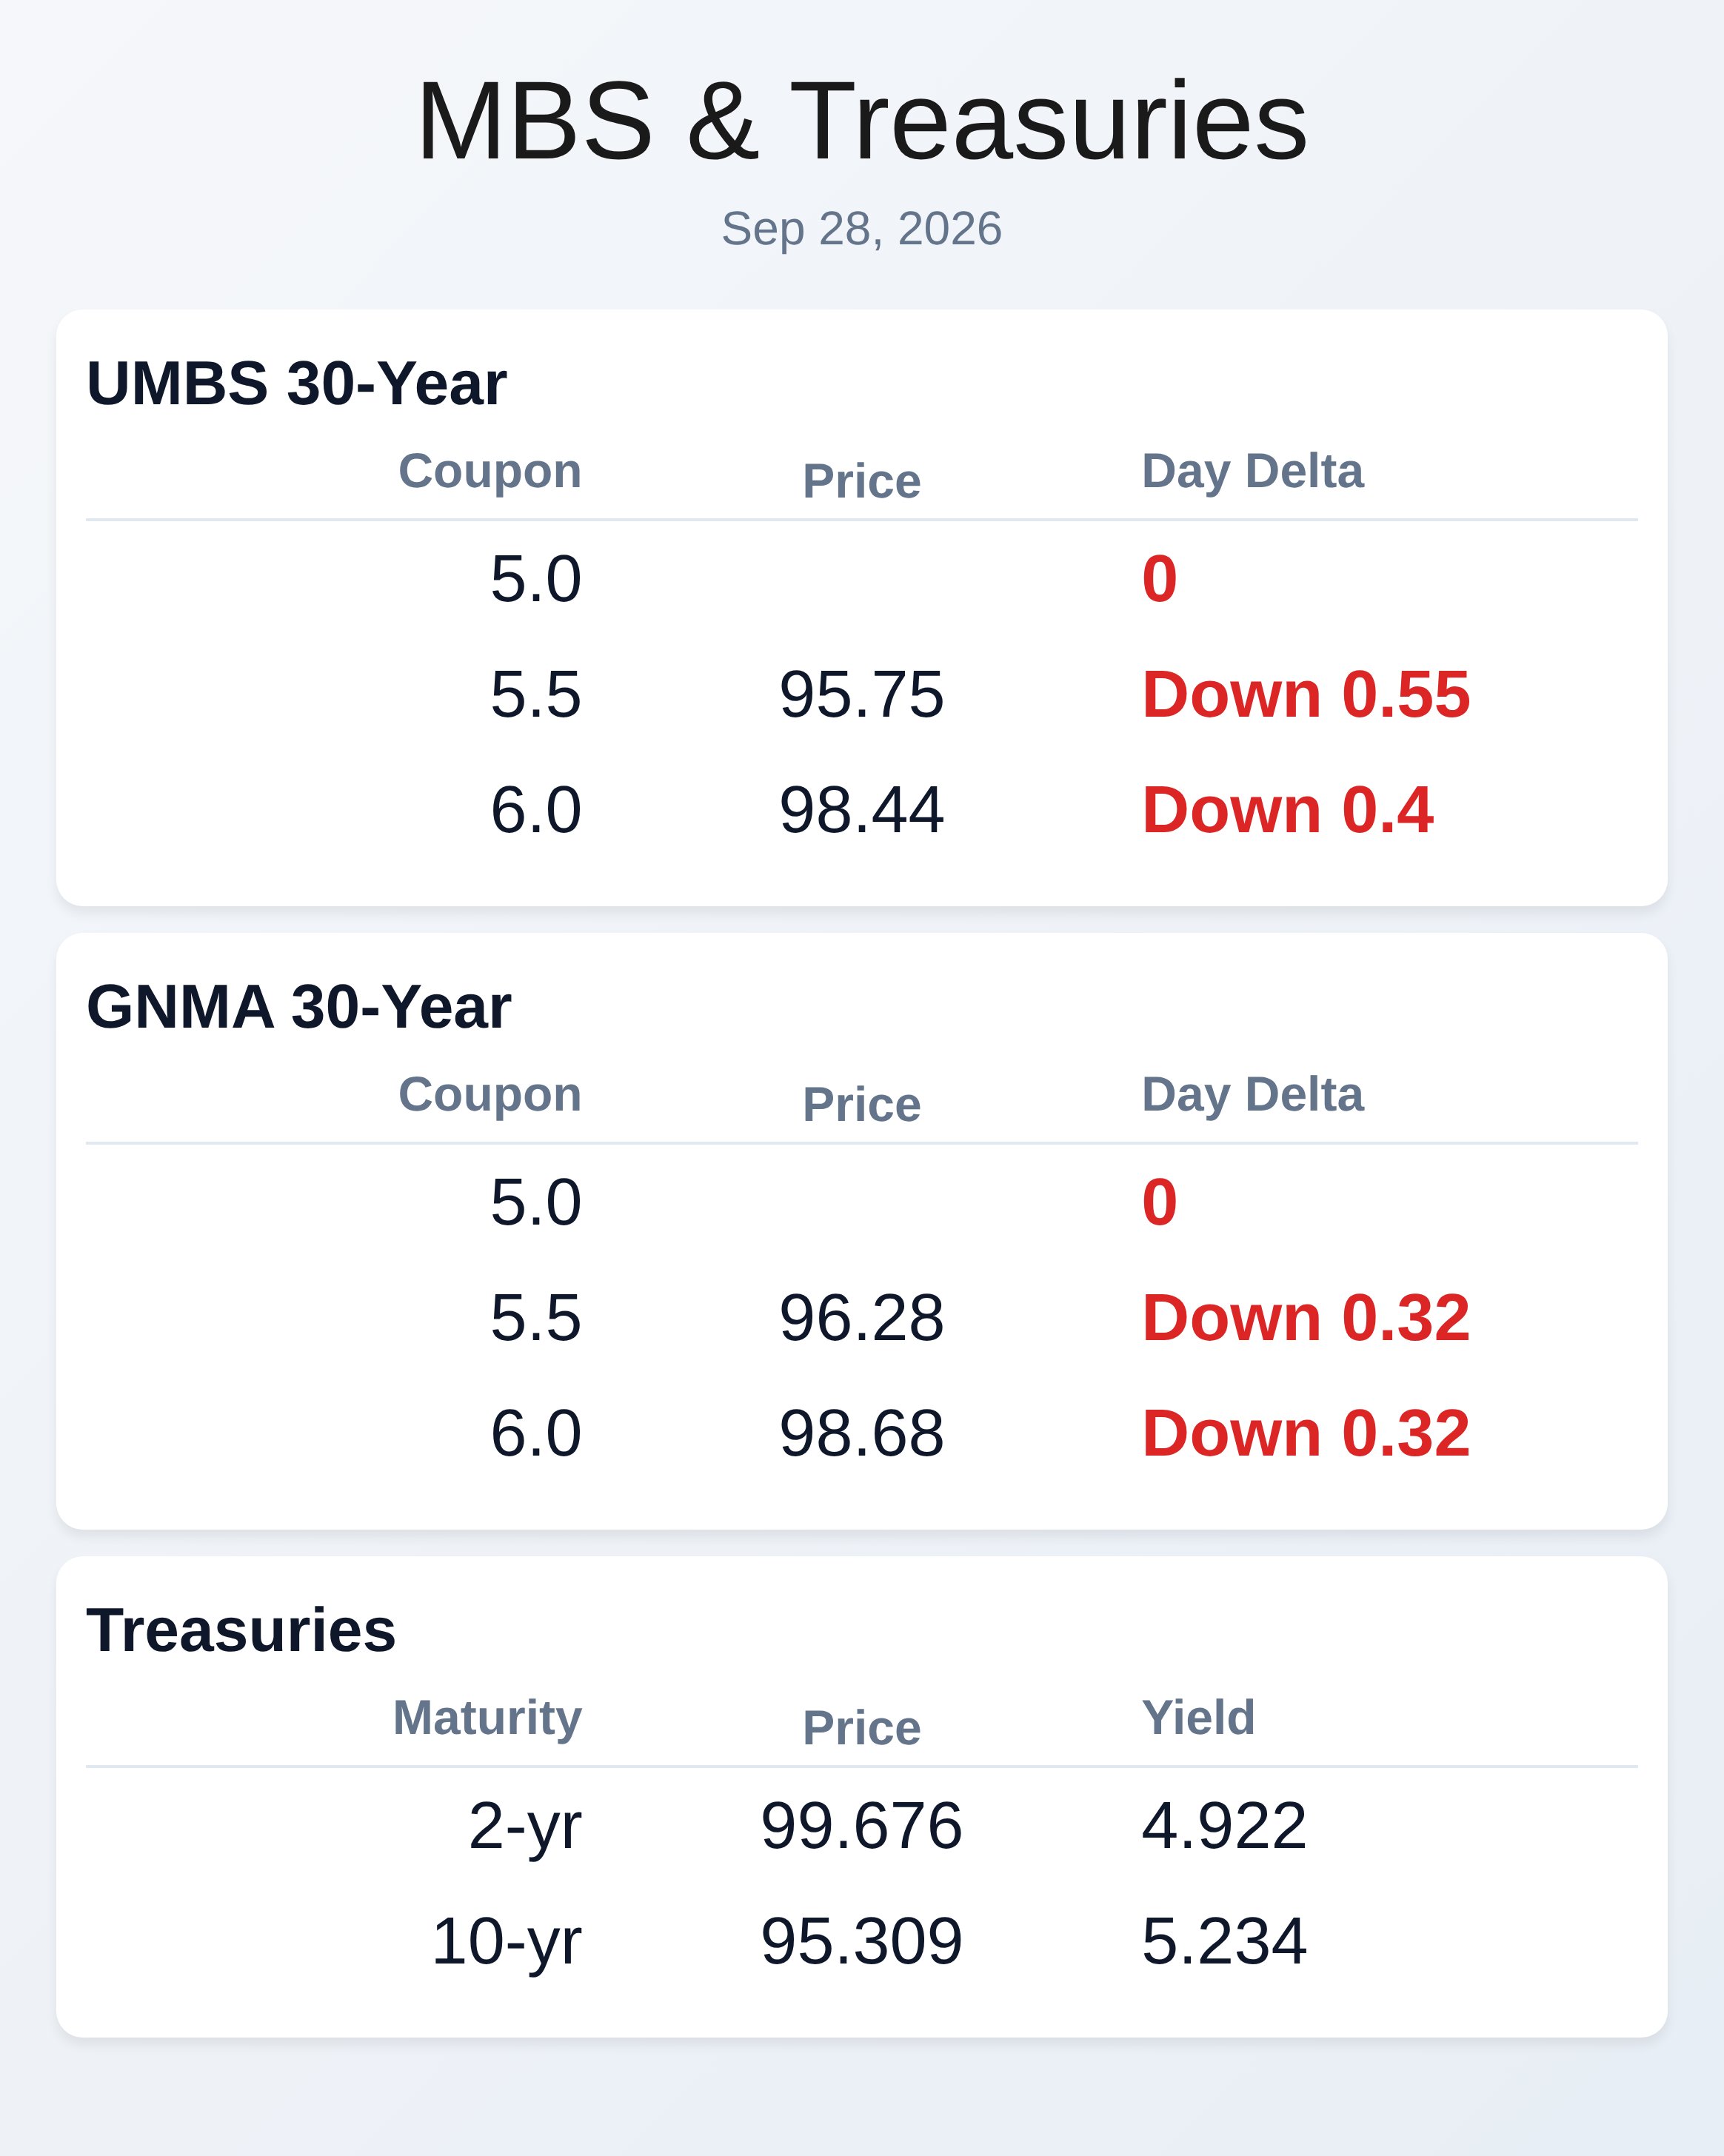
MBS securities took a beating early Monday as Treasury yields surged to two-decade highs, with the 10-year climbing to 5.23% and the 30-year near 5.55%, extending what increasingly looks like a permanent shift higher. UMBS 30-year coupons ranged from 95.75 (5.5% coupon) down 0.55 points to 100.83 (6.5% coupon) down 0.41, while GNMA 30-year coupons showed relative resilience with smaller intraday declines across the board. The catalyst remains a combination of hawkish Fed communication, resilient economic data, persistent inflation expectations, and a lack of willing bond buyers, with the market assigning roughly a 70% probability to an October rate hike.
The real question facing lenders is whether Friday’s modest rally—driven more by valuation bargain-hunting than conviction—signals we’re finally out of the woods or merely a correction before further selling. Extension and liquidity risks have exploded as wider basis spreads, weaker specified pools, and higher primary rates force originators to navigate blown-out rate sheets and elevated trading levels. Affordability is reaching a breaking point, with consumer sentiment at four-month lows and one-year inflation expectations jumping to 4.6%.
Buydown mortgages have emerged as a critical tool, now representing roughly $45 billion or about 2% of the Ginnie Mae II single-family universe, particularly in FHA and VA lending where they account for two-thirds of issuance. The product temporarily reduces borrower rates for one to three years while absorbing costs through sellers, builders, or lenders, attracting stronger-credit borrowers with FICO scores averaging 20 points higher than comparable loans. The Federal Reserve faces an uncomfortable dilemma: how much economic weakness will it tolerate before changing course if inflation remains the priority?
Historical precedent from 2022–2023 suggests the Fed may tolerate considerable stress in housing, equities, and rate-sensitive sectors while maintaining restrictive policy. However, competing arguments suggest current inflation stems less from excess domestic demand and more from temporary supply-side forces like tariffs, geopolitical shocks, and AI investment buildout, while wage growth slows and housing-price gains remain modest. If that’s true, further rate hikes could damage the economy without addressing underlying inflation drivers, meaning the market will search for visible economic cracks that finally convince the Fed to pivot.
This week’s economic calendar includes core PCE inflation, consumer income and spending, JOLTS, ADP, and ISM manufacturing reports, with Friday’s employment data potentially the most consequential. Payroll growth is expected to slow to roughly 95,000 jobs in September while unemployment holds near 4.1%, suggesting labor softening even as spending and income remain relatively strong. Energy inflation tied to the Iran conflict, particularly record diesel prices, threatens to intensify cost-of-living pressures across transportation and production sectors.
Consumer confidence deterioration combined with rising inflation expectations creates a fragile backdrop for the housing market heading into what mortgage originators had hoped would be a more stable autumn season. Mortgage industry consolidation concerns continue to percolate, with technology playing an increasingly central role in how smaller lenders compete with larger platforms. Conferences scheduled for this week and next—including MBA’s Compliance and Risk Management Conference, the Virginia Mortgage Banker’s Association Annual Convention, and MBA Annual 2026—provide networking opportunities and insight into shifting competitive dynamics.
Industry discussions focus heavily on AI governance, loan origination technology, and how lenders can streamline borrower experiences while maintaining compliance in an increasingly complex market. The emerging consensus suggests that companies struggling with the build-versus-buy decision for technology solutions need clarity on which tools drive strategic advantage versus which are table-stakes requirements. Loan officers and branch managers continue to evaluate where they can build their businesses most effectively, with family-owned mortgage companies emphasizing autonomy and direct leadership access as competitive differentiators.
Margin management tools and pricing analytics have become essential for retail channel lenders attempting to balance competitive pricing with controlled loan exceptions, particularly as spreads have widened and production coupons have become less attractive. Lenders searching for buydown opportunities or early-life prepayment protection in MBS pools are finding interesting pockets as they seek to bridge the affordability gap created by elevated home prices and high mortgage rates. The next few weeks will test whether originators can execute effectively while managing rate volatility and protecting their profitability as economic headwinds build.
**Locking vs Floating**
Market technicians face a pivotal decision as a decent bond rally Friday raised questions about whether it represents genuine recovery or merely a correction before further selling. The MBS decline of 11 ticks and 10-year yield increase of 4.8 basis points suggest weakness persists despite token improvement, and experts recommend waiting for stronger, more conviction-driven rallies before adjusting lock-float positioning. The extreme level of rate-sheet deterioration creates high risk-reward dynamics in the days ahead, meaning disciplined originators should hold protective positions and monitor whether the market demonstrates sustained appetite to move higher without heavy-selling catalysts driving moves.
**Today’s Events**
No economic data releases scheduled for September 28, 2026. Markets remain focused on forward guidance ahead of this week’s economic reports and next week’s employment data.
**Bond Pricing**
**UMBS 30 yr**
| Coupon | Price | Intra-Day Change |
| 5.5 | 95.75 | -0.55 |
| 6.0 | 98.44 | -0.4 |
| 5.5 | 96.28 | -0.32 |
**GNMA 30 yr**
| Coupon | Price | Intra-Day Change |
**Treasuries**
| Term | Yield | Price | Intra-Day Yield Change |
| 2 yr | 4.922 | 99.676 | 0.062 |
| 3 yr | 5.005 | 98.266 | 0.073 |
| 5 yr | 5.066 | 99.713 | 0.075 |
| 7 yr | 5.148 | 99.137 | 0.075 |
| 10 yr | 5.234 | 95.309 | 0.073 |
| 30 yr | 5.547 | 93.871 | 0.053 |