**WTMS Blog Today = What’s up in Mortgage Today (PM) – 05/28/2026**
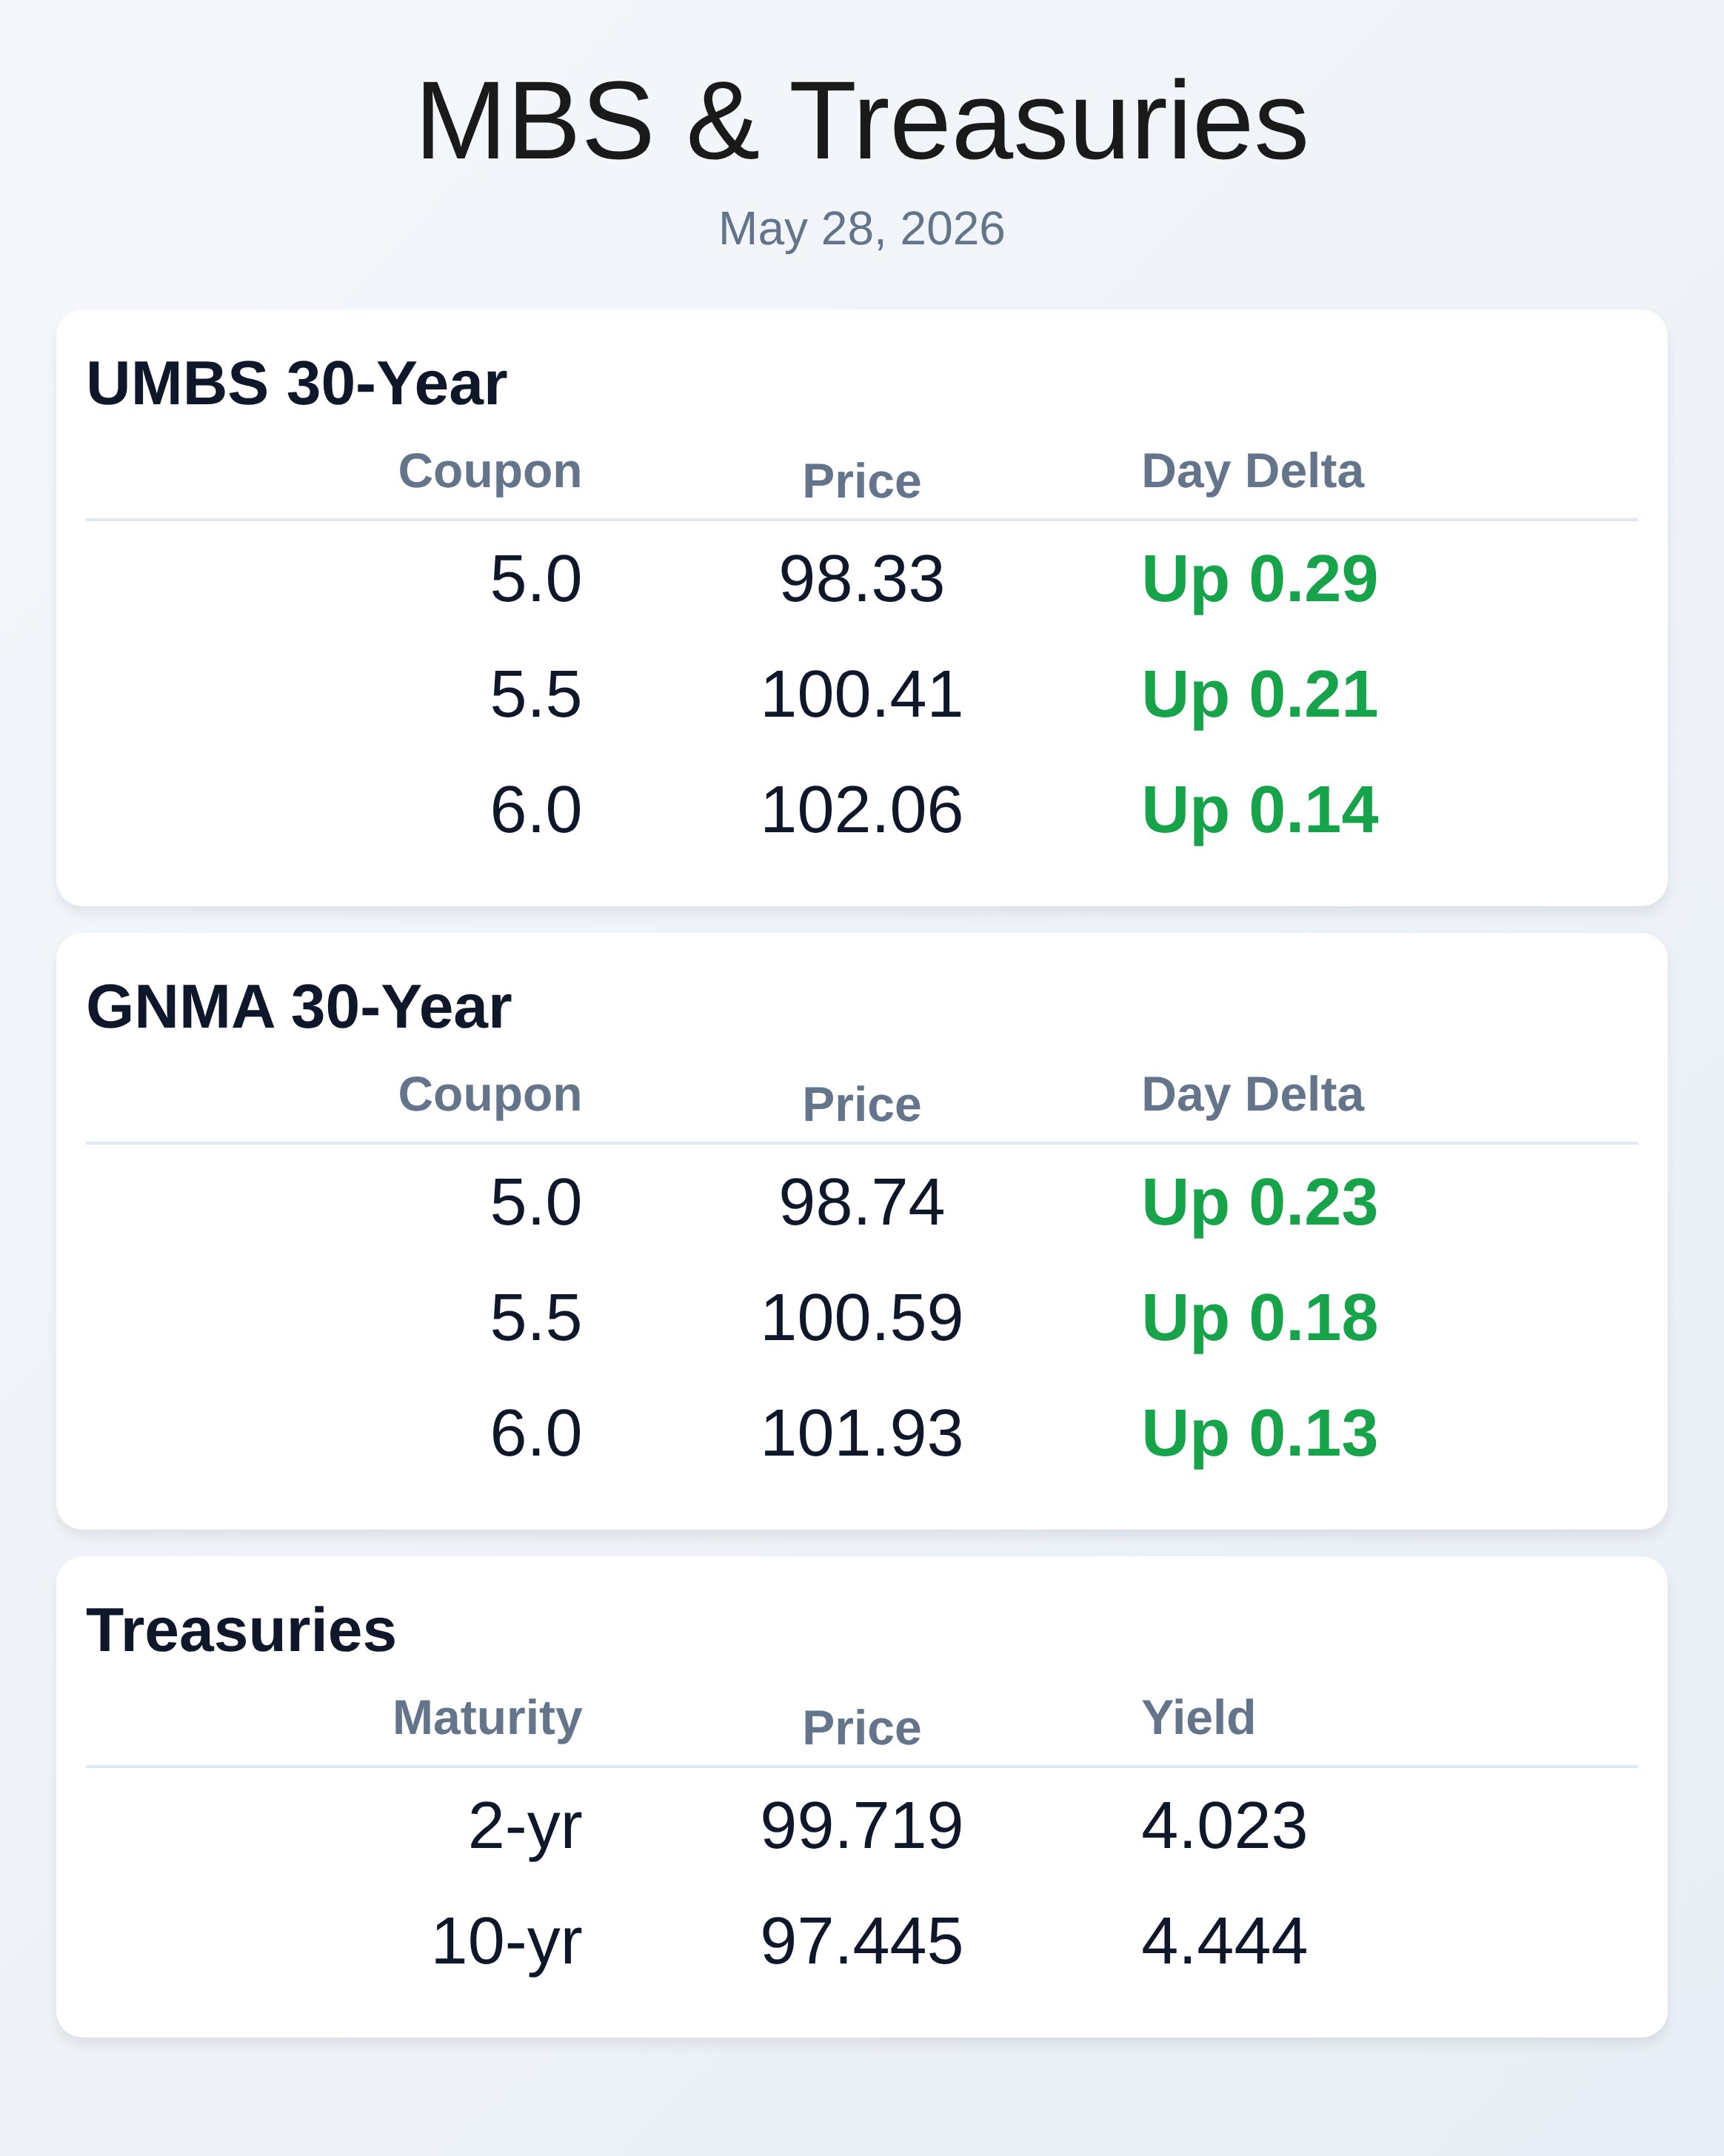
Bonds spent the day dancing to geopolitical headlines, rallying nearly 3.5 basis points as peace deal reports from the Middle East triggered risk-on buying. The 10-year Treasury fell to 4.45% by mid-afternoon, and UMBS 5.0 climbed 27 ticks on the good news flow. However, conflicting reports about Iran’s participation kept volatility elevated throughout the session, suggesting that any breakdown in negotiations could quickly reverse today’s gains.
Mortgage spreads remain historically tight despite steady 10-year yields, reflecting investor reluctance to extend duration in an uncertain environment. All-cash home purchases slid to 29% in March from a 35% peak in 2023, showing that higher mortgage spreads are finally pricing real estate speculators out of the market. Cleveland and West Palm Beach remain the hotspots for cash buyers, while the Rust Belt is attracting investors priced out of coastal markets.
This shift signals a normalization in housing demand away from pure wealth-driven purchases toward fundamental owner-occupant activity. Chicago Federal Reserve President Austan Goolsbee flagged persistent energy inflation as a potential stagflationary risk, particularly for Asian economies. He acknowledged his recent dissenting Fed vote and expressed concern that AI investment and stock market wealth gains could fuel excessive consumer spending in the near term.
While AI should ultimately raise productivity and the economy’s growth speed limit, data center construction is consuming resources and driving up electricity costs for workers. These competing forces create inflation headwinds in the short run even as long-term prospects improve. Economic data painted a mixed picture: Core PCE inflation came in slightly softer than expected at 0.2% month-over-month, but durable goods orders surged 7.9% and core capital expenditures fell 1.1%.
First-quarter GDP missed forecasts at 1.6%, while corporate profits plunged 0.4% against expectations of 5.7% growth. These contradictions mean the Fed still faces difficulty in its rate path, keeping long-duration securities vulnerable to sudden reversals. Cash buying declines across real estate indicate that speculators are stepping back as price appreciation stalls on a year-over-year basis.
The outsized appreciation seen in 2022–2023 is now history, and investors face uncertainty from tariffs, geopolitical risk, and tighter lending spreads. This recalibration removes artificial bid from the housing market and restores focus to borrower fundamentals. Originators should expect purchase volume to stabilize around core demographics and household formation rather than pure cash-driven activity.
Lock-in rates appear justified given war-related volatility and the potential for negative surprises if peace negotiations falter. Borrowers locking now secure today’s relatively low yields before any geopolitical reversal pushes rates higher again. The technical floor at 4.40 on the 10-year supports near-term calm, but ceiling resistance at 4.72 remains within reach if headline risk accelerates.
Originators should position clients for stability while monitoring Middle East updates for intraday opportunities.
**Locking vs Floating**
Bonds remain captive to war-related headlines and show surprising rally capacity when peace reports surface. However, there is equally significant downside risk if negotiations stumble.
Lock now to protect against geopolitical reversals, but float if expecting official peace confirmation within days.
**Today’s Events**
Continued Claims (May/16): 1786.0K vs 1780K forecast, 1782K previous
Core CapEx (Apr): -1.1% vs 0.4% forecast, 3.4% previous
Core PCE (m/m) (Apr): 0.2% vs 0.3% forecast, 0.3% previous
Core PCE (y/y) (Apr): 3.3% vs 3.3% forecast, 3.2% previous
Core PCE Prices QoQ Q1: 4.4% vs 4.3% forecast, 2.7% previous
Corporate Profits Q1: -0.4% vs 5.7% forecast, 5.7% previous
Durable Goods (Apr): 7.9% vs 3.5% forecast, 0.8% previous
GDP Q1: 1.6% vs 2.0% forecast, 0.5% previous
GDP Final Sales Q1: 1.5% vs 1.6% forecast, 0.3% previous
Jobless Claims (May/23): 215.0K vs 211K forecast, 209K previous
PCE (y/y) (Apr): 3.8% vs 3.8% forecast, 3.5% previous
PCE Prices (m/m) (Apr): 0.4% vs 0.5% forecast, 0.7% previous
**Bond Pricing**
**UMBS 30 yr**
| Coupon | Price | Intra-Day Change |
**GNMA 30 yr**
| Coupon | Price | Intra-Day Change |
**Treasuries**
| Term | Yield | Price | Intra-Day Yield Change |