**WTMS Blog Today = What’s up in Mortgage Today (PM) – 09/29/2026**
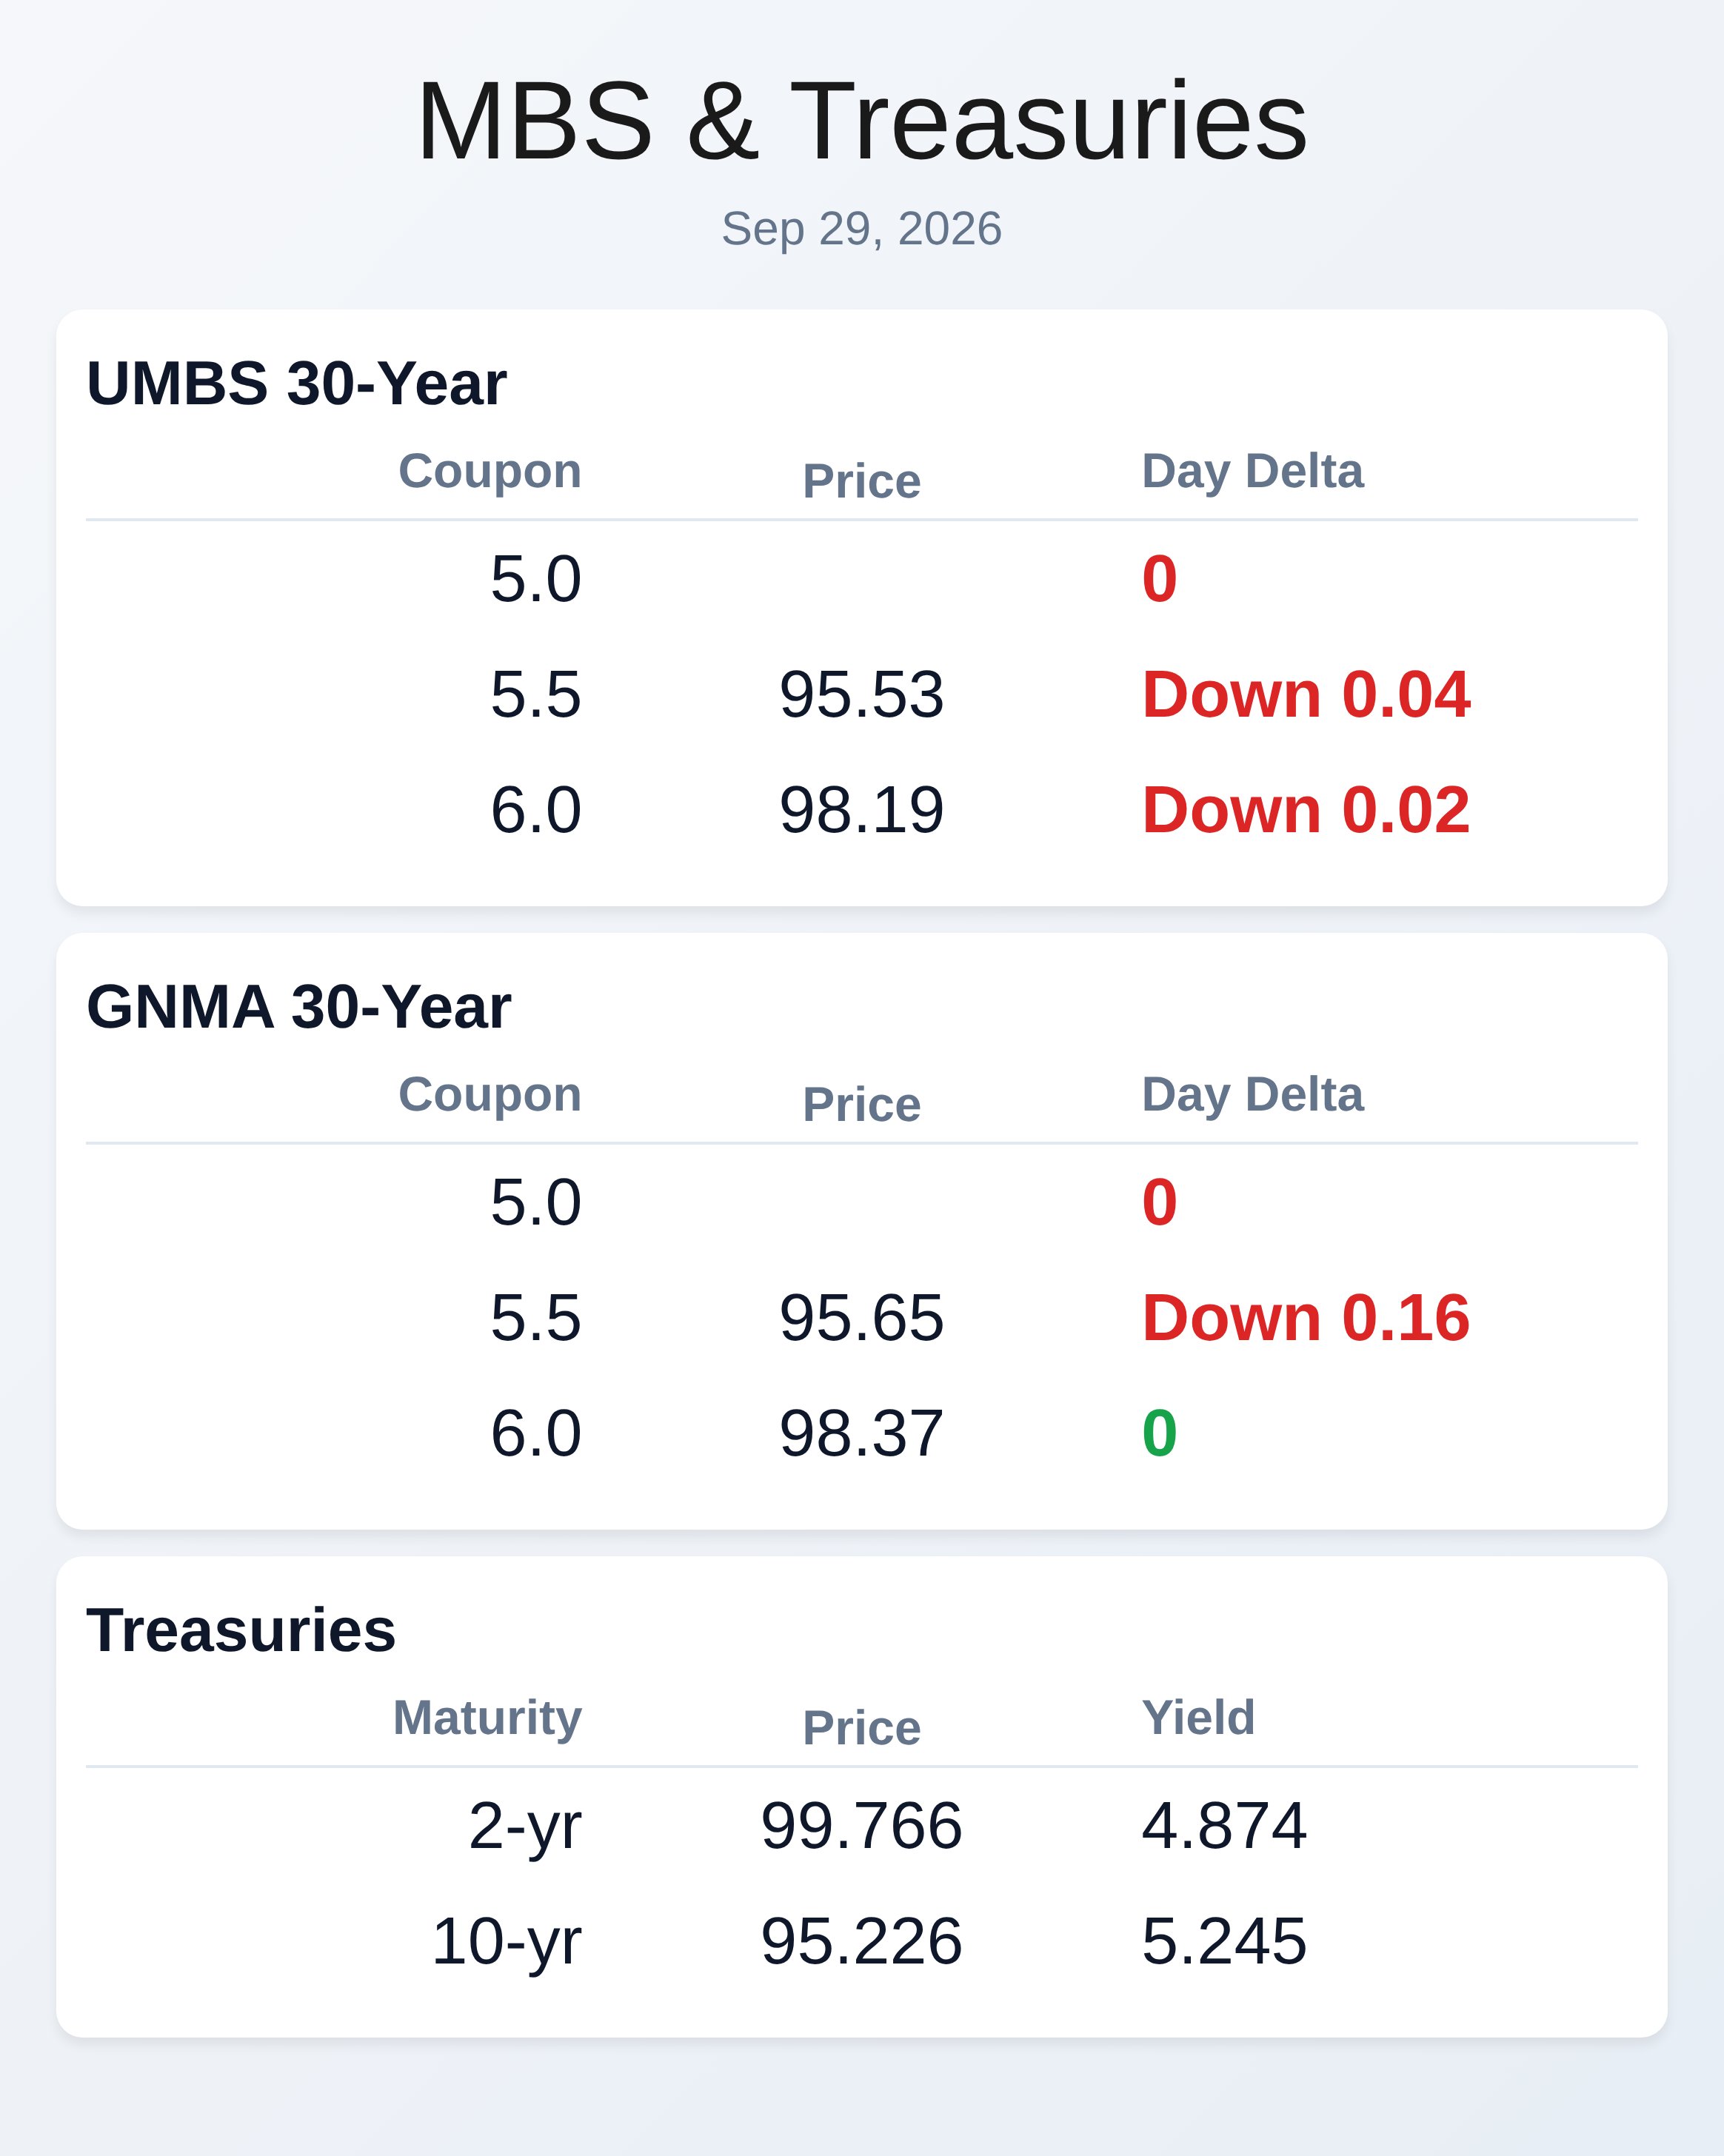
Mortgage-backed securities (UMBS) experienced a volatile intraday swing today, dropping nearly half a point before recovering moderately after Federal Reserve Governor Williams signaled no urgency for additional rate hikes. The 10-year Treasury yield crested at 5.29%—touching a critical technical level not seen since 2007—before reversing course in afternoon trading. MBS prices ended the day down roughly 0.01 to 0.03 points depending on coupon, but well off their weakest levels.
Markets responded sharply to Williams’ dovish comments, with Fed Funds Futures rallying and the entire yield curve (except 30-year bonds) returning to positive territory by close. This volatility underscores the sensitivity of mortgage securities to Fed messaging as quarter-end trading dynamics persist. Economic data released today painted a mixed picture that provided little directional momentum until Fed commentary intervened.
Case Shiller home prices rose 2.5% year-over-year (beating the 2.2% forecast), while the FHFA monthly index climbed 0.3% (above the 0.1% expectation). However, consumer confidence slumped to 81.9, well below the 89.2 forecast, and job openings fell to 7.079 million from 7.271 million previously. The weakness in confidence and employment metrics suggests underlying economic softness that could eventually support bond rallies, though today’s data alone triggered only modest price responses.
Lenders reported negative repricing risk approaching 0.25 points by mid-afternoon as MBS weakness mounted. The morning session proved brutal, with heavy selling between 9:30 a.m. and 10:00 a.m.
that pushed MBS down over an eighth of a point despite falling oil prices offering no support. Bearish momentum combined with quarter-end portfolio adjustments (correlating with stock market weakness) appeared to be the primary driver rather than specific economic or policy catalysts. By 10:05 a.m., the 10-year yield had risen 1.1 basis points to 5.25%, and MBS losses accelerated through early afternoon.
The lack of any fundamental justification for the selling—particularly with oil prices declining—suggests technical forces and repositioning dominated price action. Williams’ 2:00 p.m. statement that he sees no need for urgency following September’s rate hike proved to be the session’s turning point, effectively halting the bleeding in fixed-income markets.
His comments carried extra weight given his status among Fed speakers and represented a notably more dovish tone than recent messaging from other officials. The short end of the yield curve responded particularly well, with the 2-year yield declining 5.3 basis points, while the 10-year finished just 0.3 basis points higher at 5.236%. By day’s close, MBS had recovered roughly three-eighths of a point from their lows, though many lenders remained at risk of additional negative reprices depending on their rate sheet timing.
**Locking vs Floating**
Originators should continue holding the lock/float stance unchanged from Monday, waiting for bonds to demonstrate genuine rally strength that is not merely a rebound from heavy selling. If upcoming economic data comes in weak and bonds recover sustainably, mortgage rates could see substantial relief; conversely, stronger data would likely add to recent upward momentum. The risk/reward at current levels remains unfavorable for aggressively floating, given the proximity to 2007 technical resistance and persistent quarter-end volatility.
**Today’s Events**
| Event | Actual | Forecast | Previous |
|—|—|—|—|
| Case Shiller Home Prices-20 y/y (Jul) | 2.5% | 2.2% | 2.1% |
| FHFA Home Price Index m/m (Jul) | 0.3% | 0.1% | 0% |
| CB Consumer Confidence (Sep) | 81.9 | 89.2 | 89.4 |
| USA JOLTS Job Openings (Aug) | 7.079M | 7.23M | 7.271M |
**Bond Pricing**
**UMBS 30 yr**
| Coupon | Price | Intra-Day Change |
| 5.5 | 95.53 | -0.04 |
| 6.0 | 98.19 | -0.02 |
| 5.5 | 95.65 | -0.16 |
**GNMA 30 yr**
| Coupon | Price | Intra-Day Change |
**Treasuries**
| Term | Yield | Price | Intra-Day Yield Change |
| 2 yr | 4.874 | 99.766 | -0.053 |
| 3 yr | 4.978 | 98.34 | -0.031 |
| 5 yr | 5.05 | 99.781 | -0.019 |
| 7 yr | 5.142 | 99.172 | -0.007 |
| 10 yr | 5.245 | 95.226 | 0.011 |
| 30 yr | 5.569 | 93.566 | 0.02 |