
“Damn, there is so much great knowledge out there. Did you know that “BOOKS” are full of smart?? No, I mean like life changing, I-wish-I-knew-that-years-ago type stuff.
I know that I was waaaayyy late to the game figuring it out. And I know that a lot of you are too busy to read as much as you ‘should’. And that is why you need me.
I still remember how it started for me. It started in June of 2008. After 11 years …..Click to continue
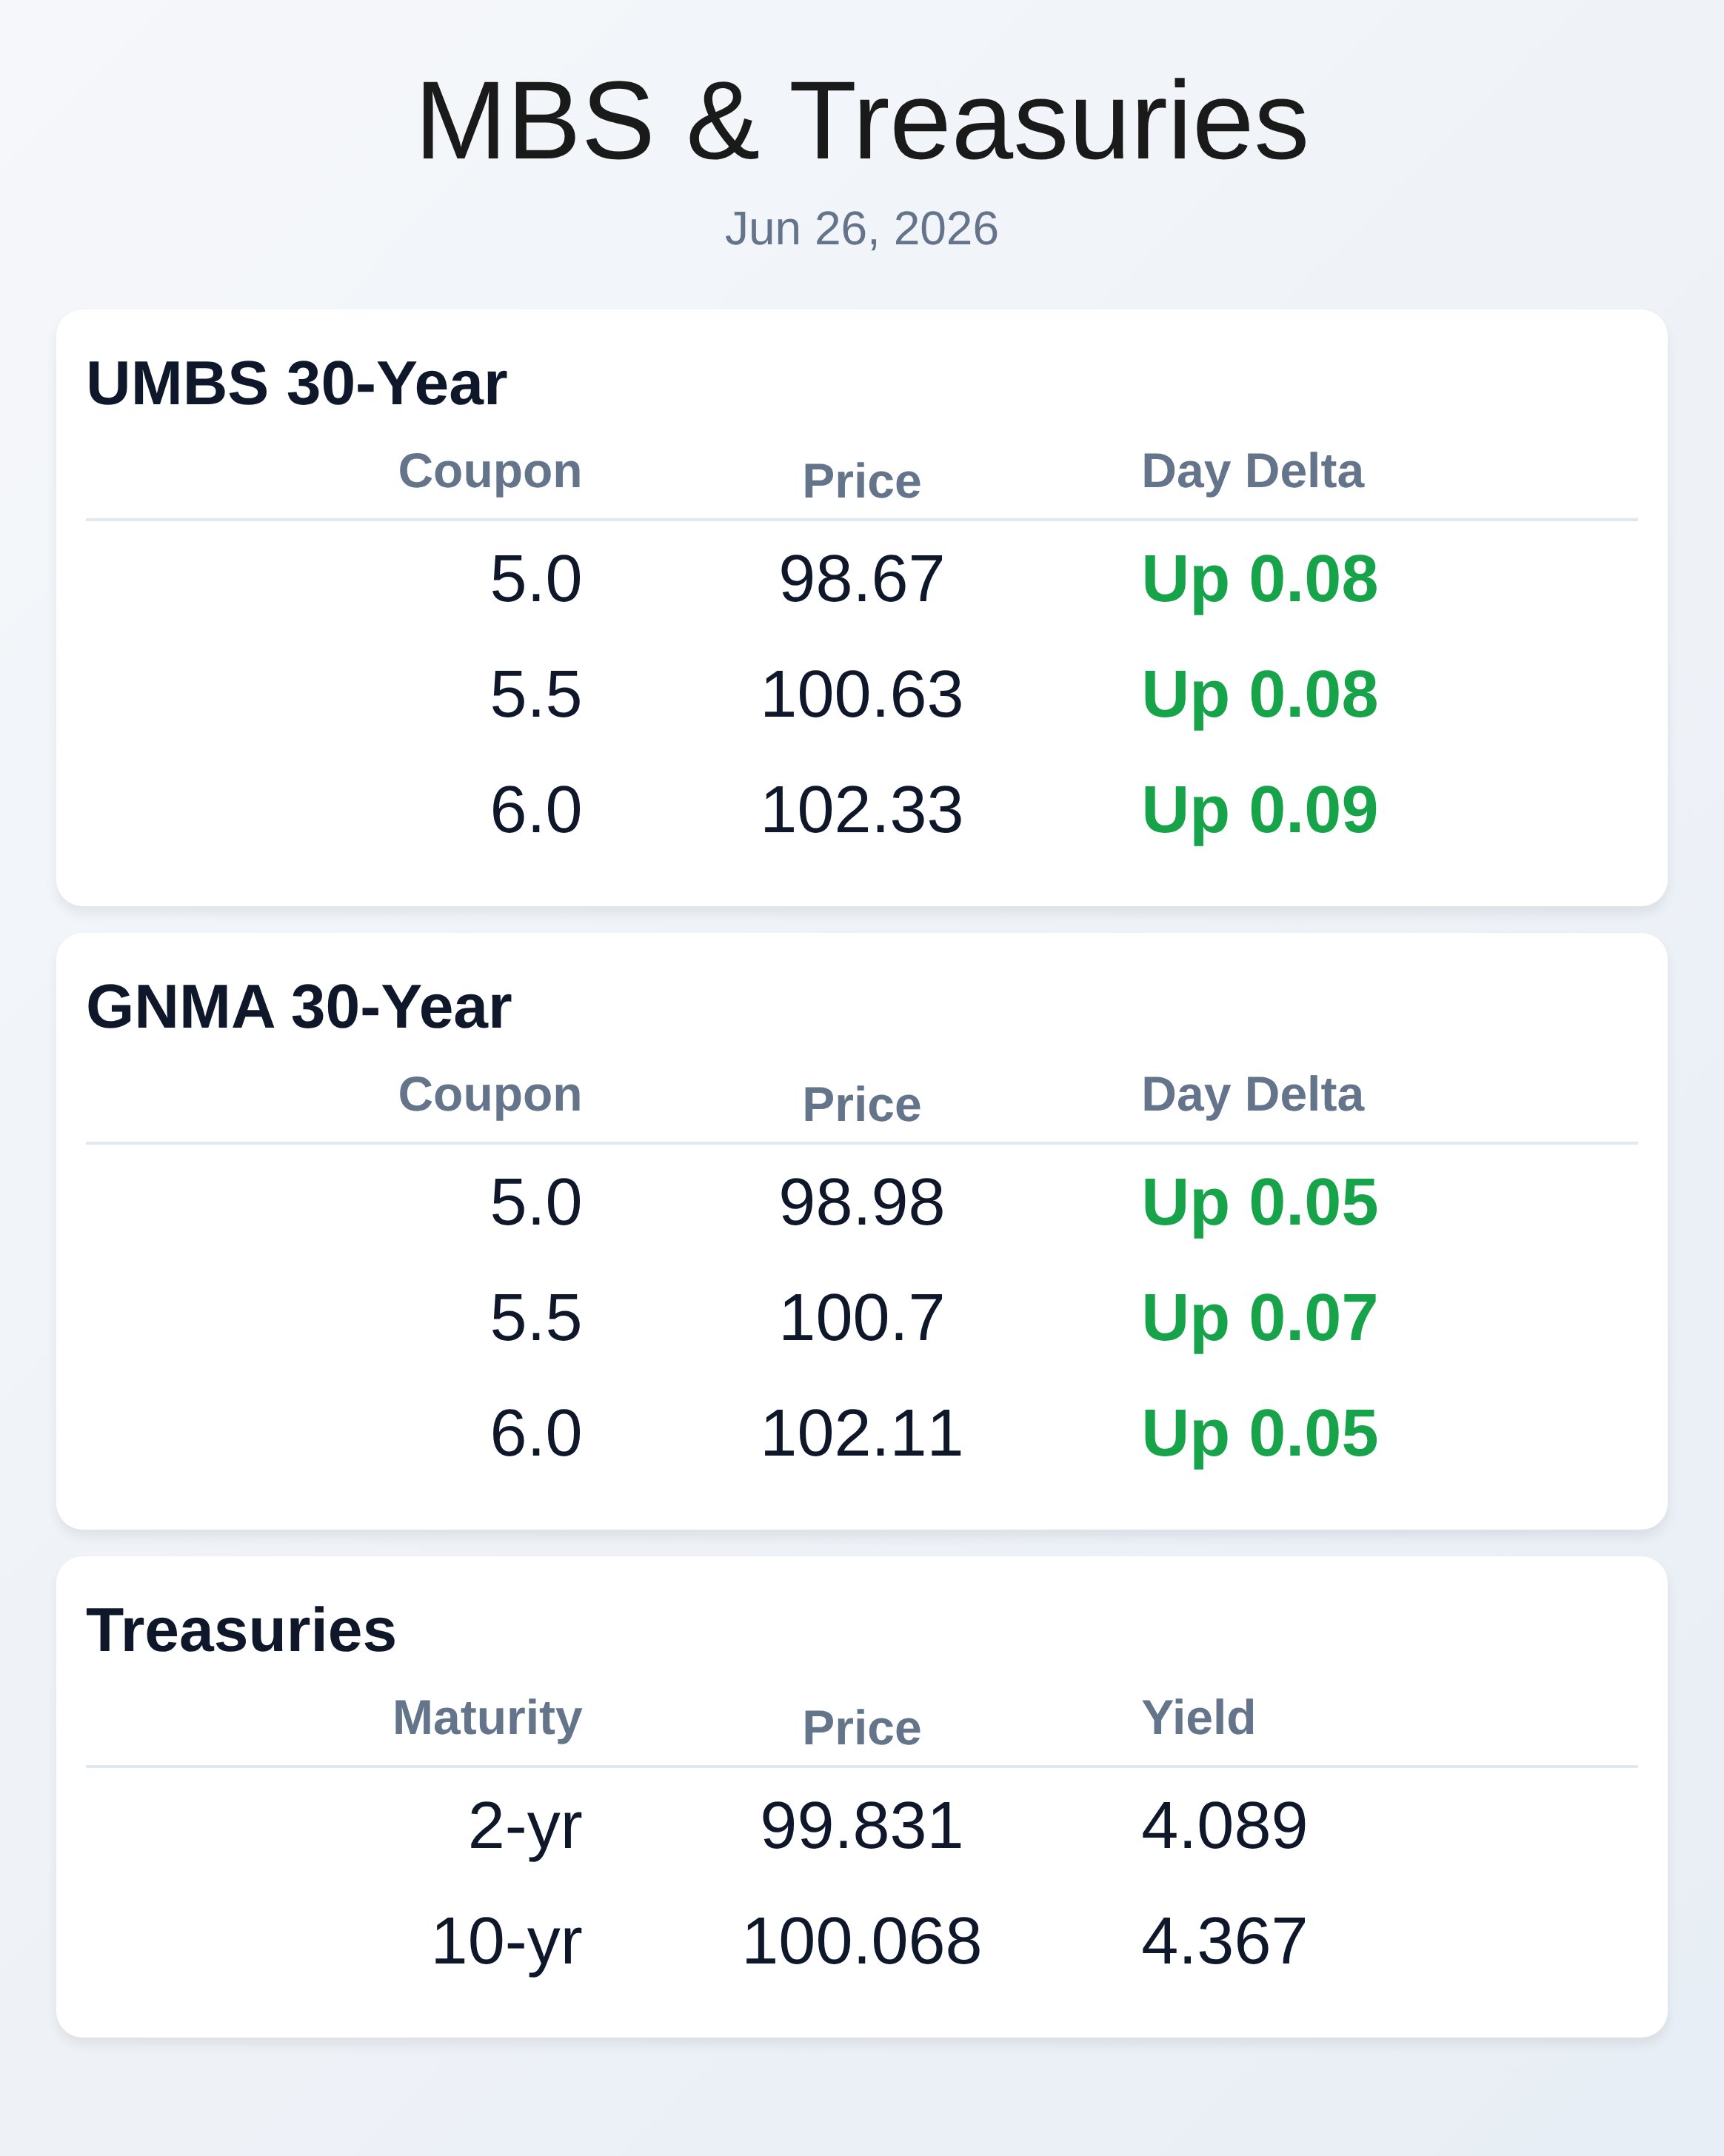
June 26, 2026
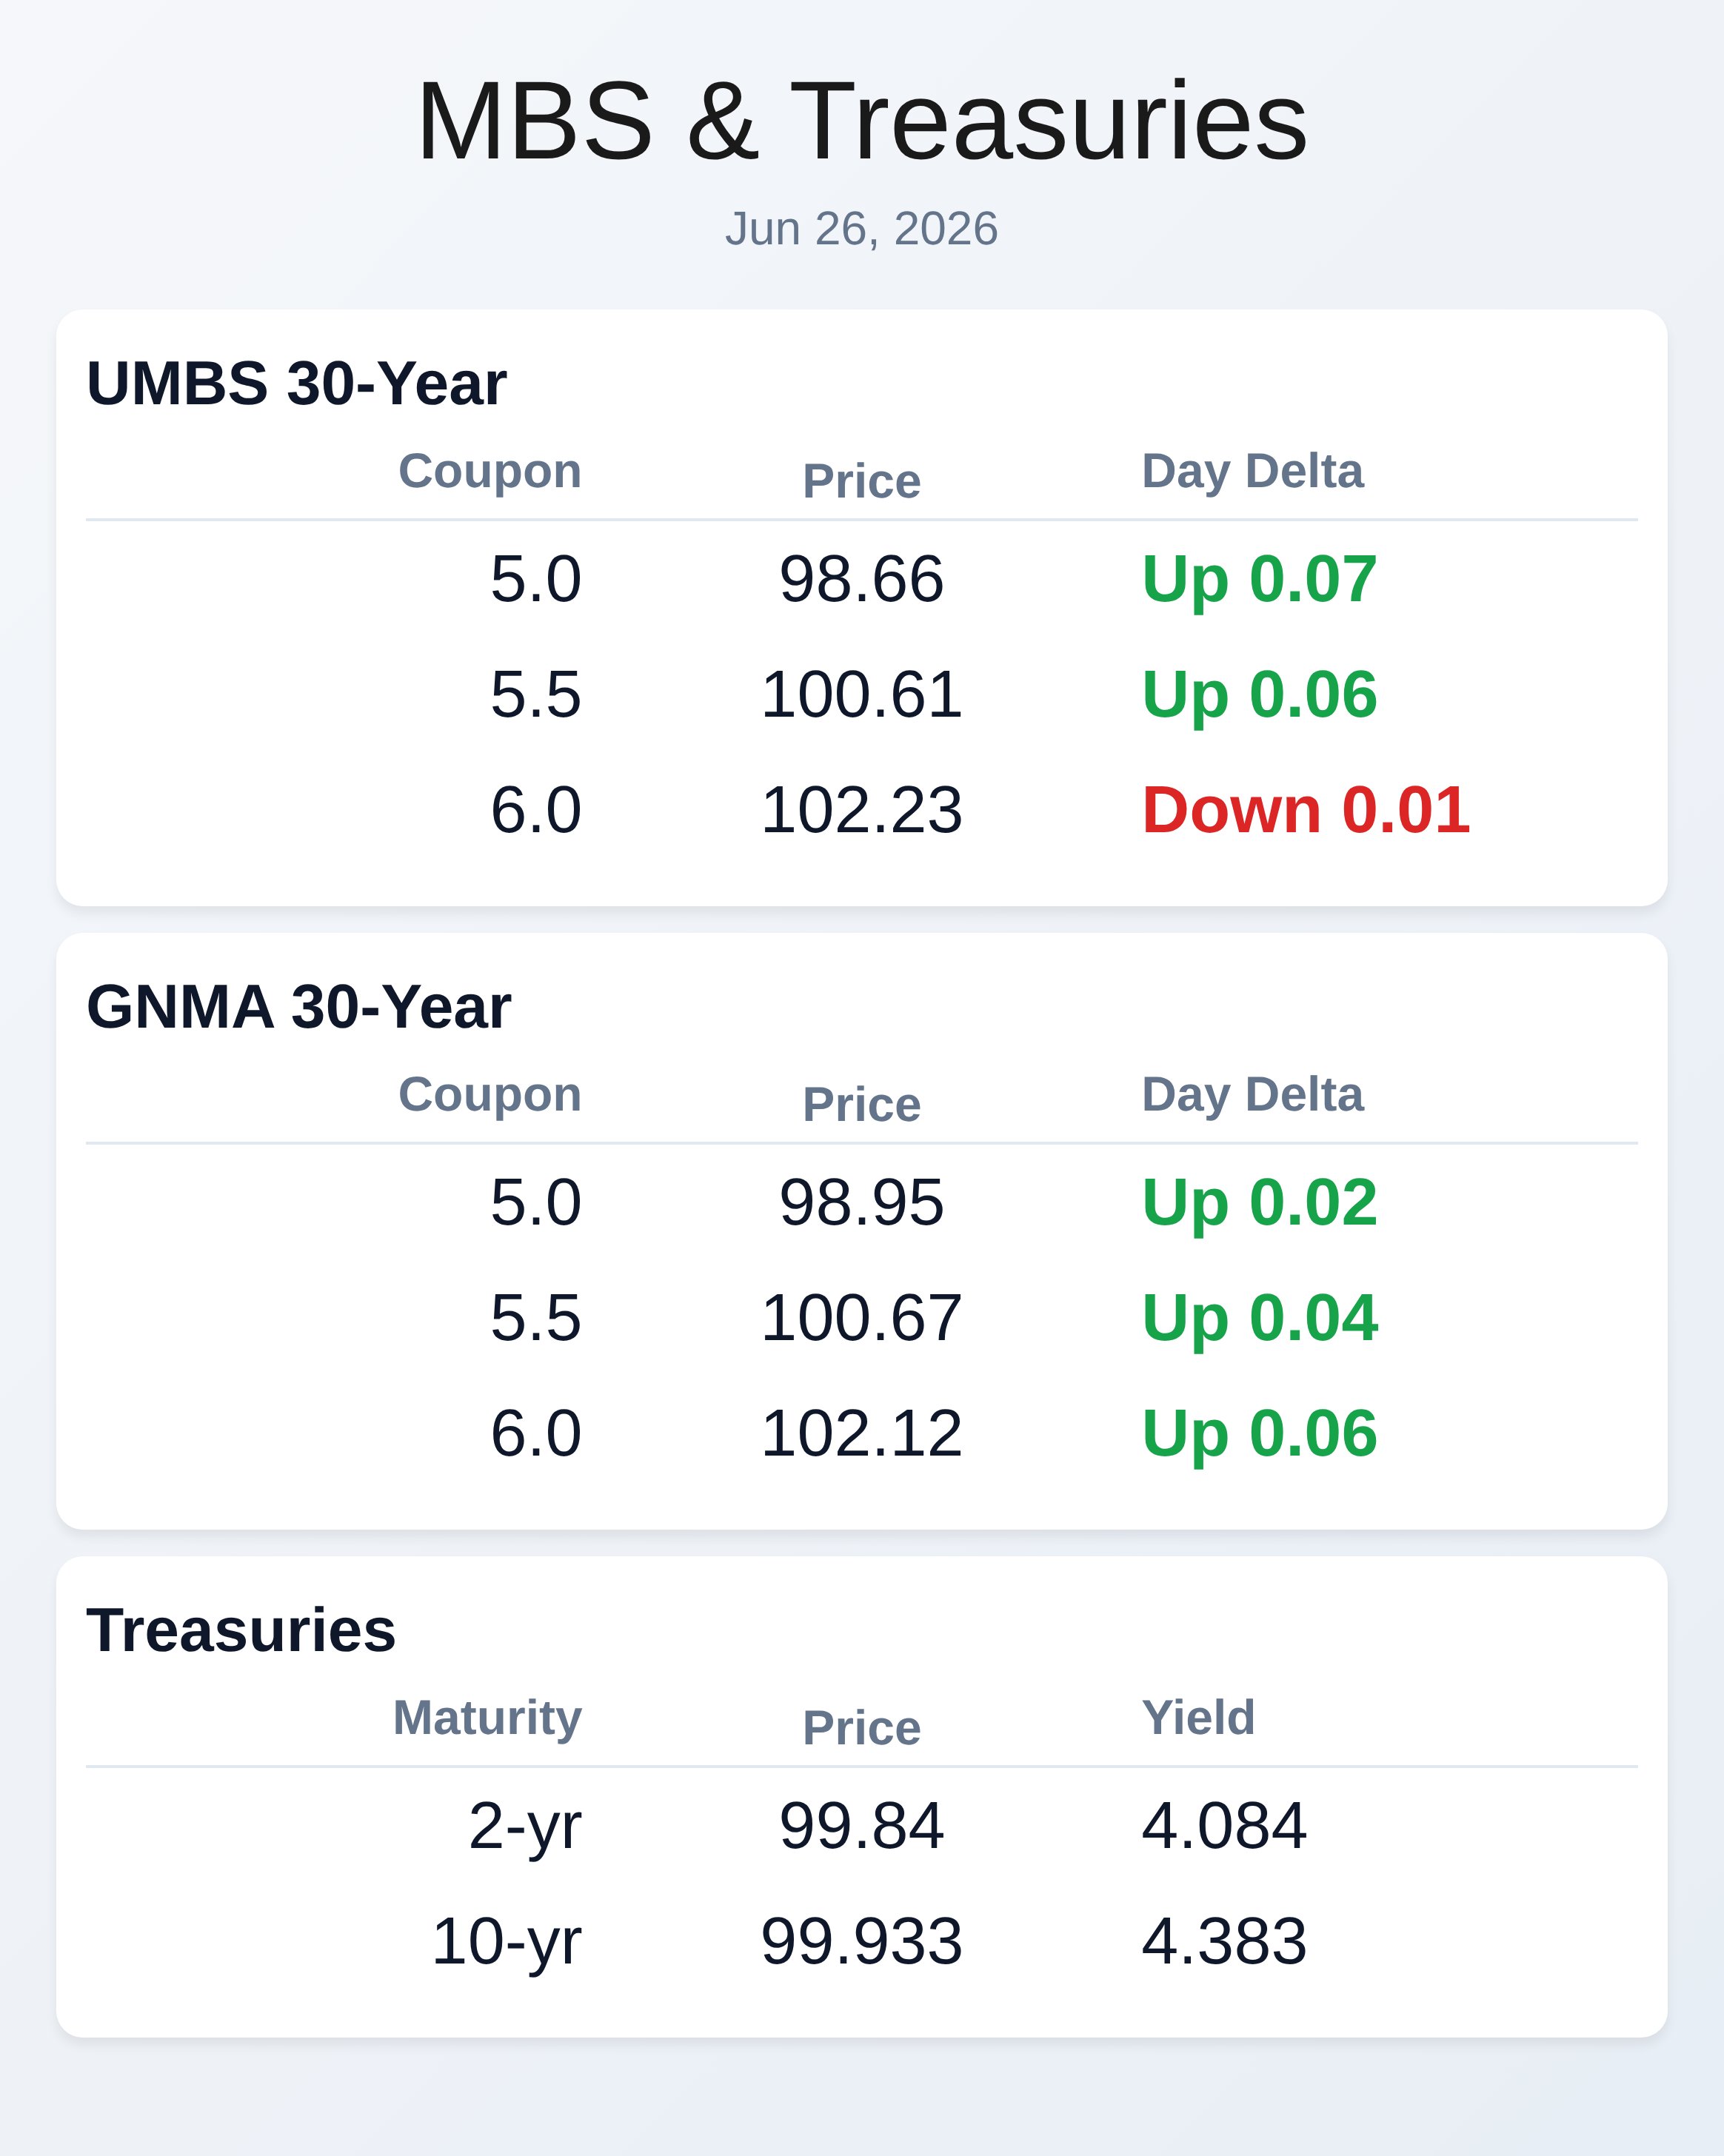
June 26, 2026
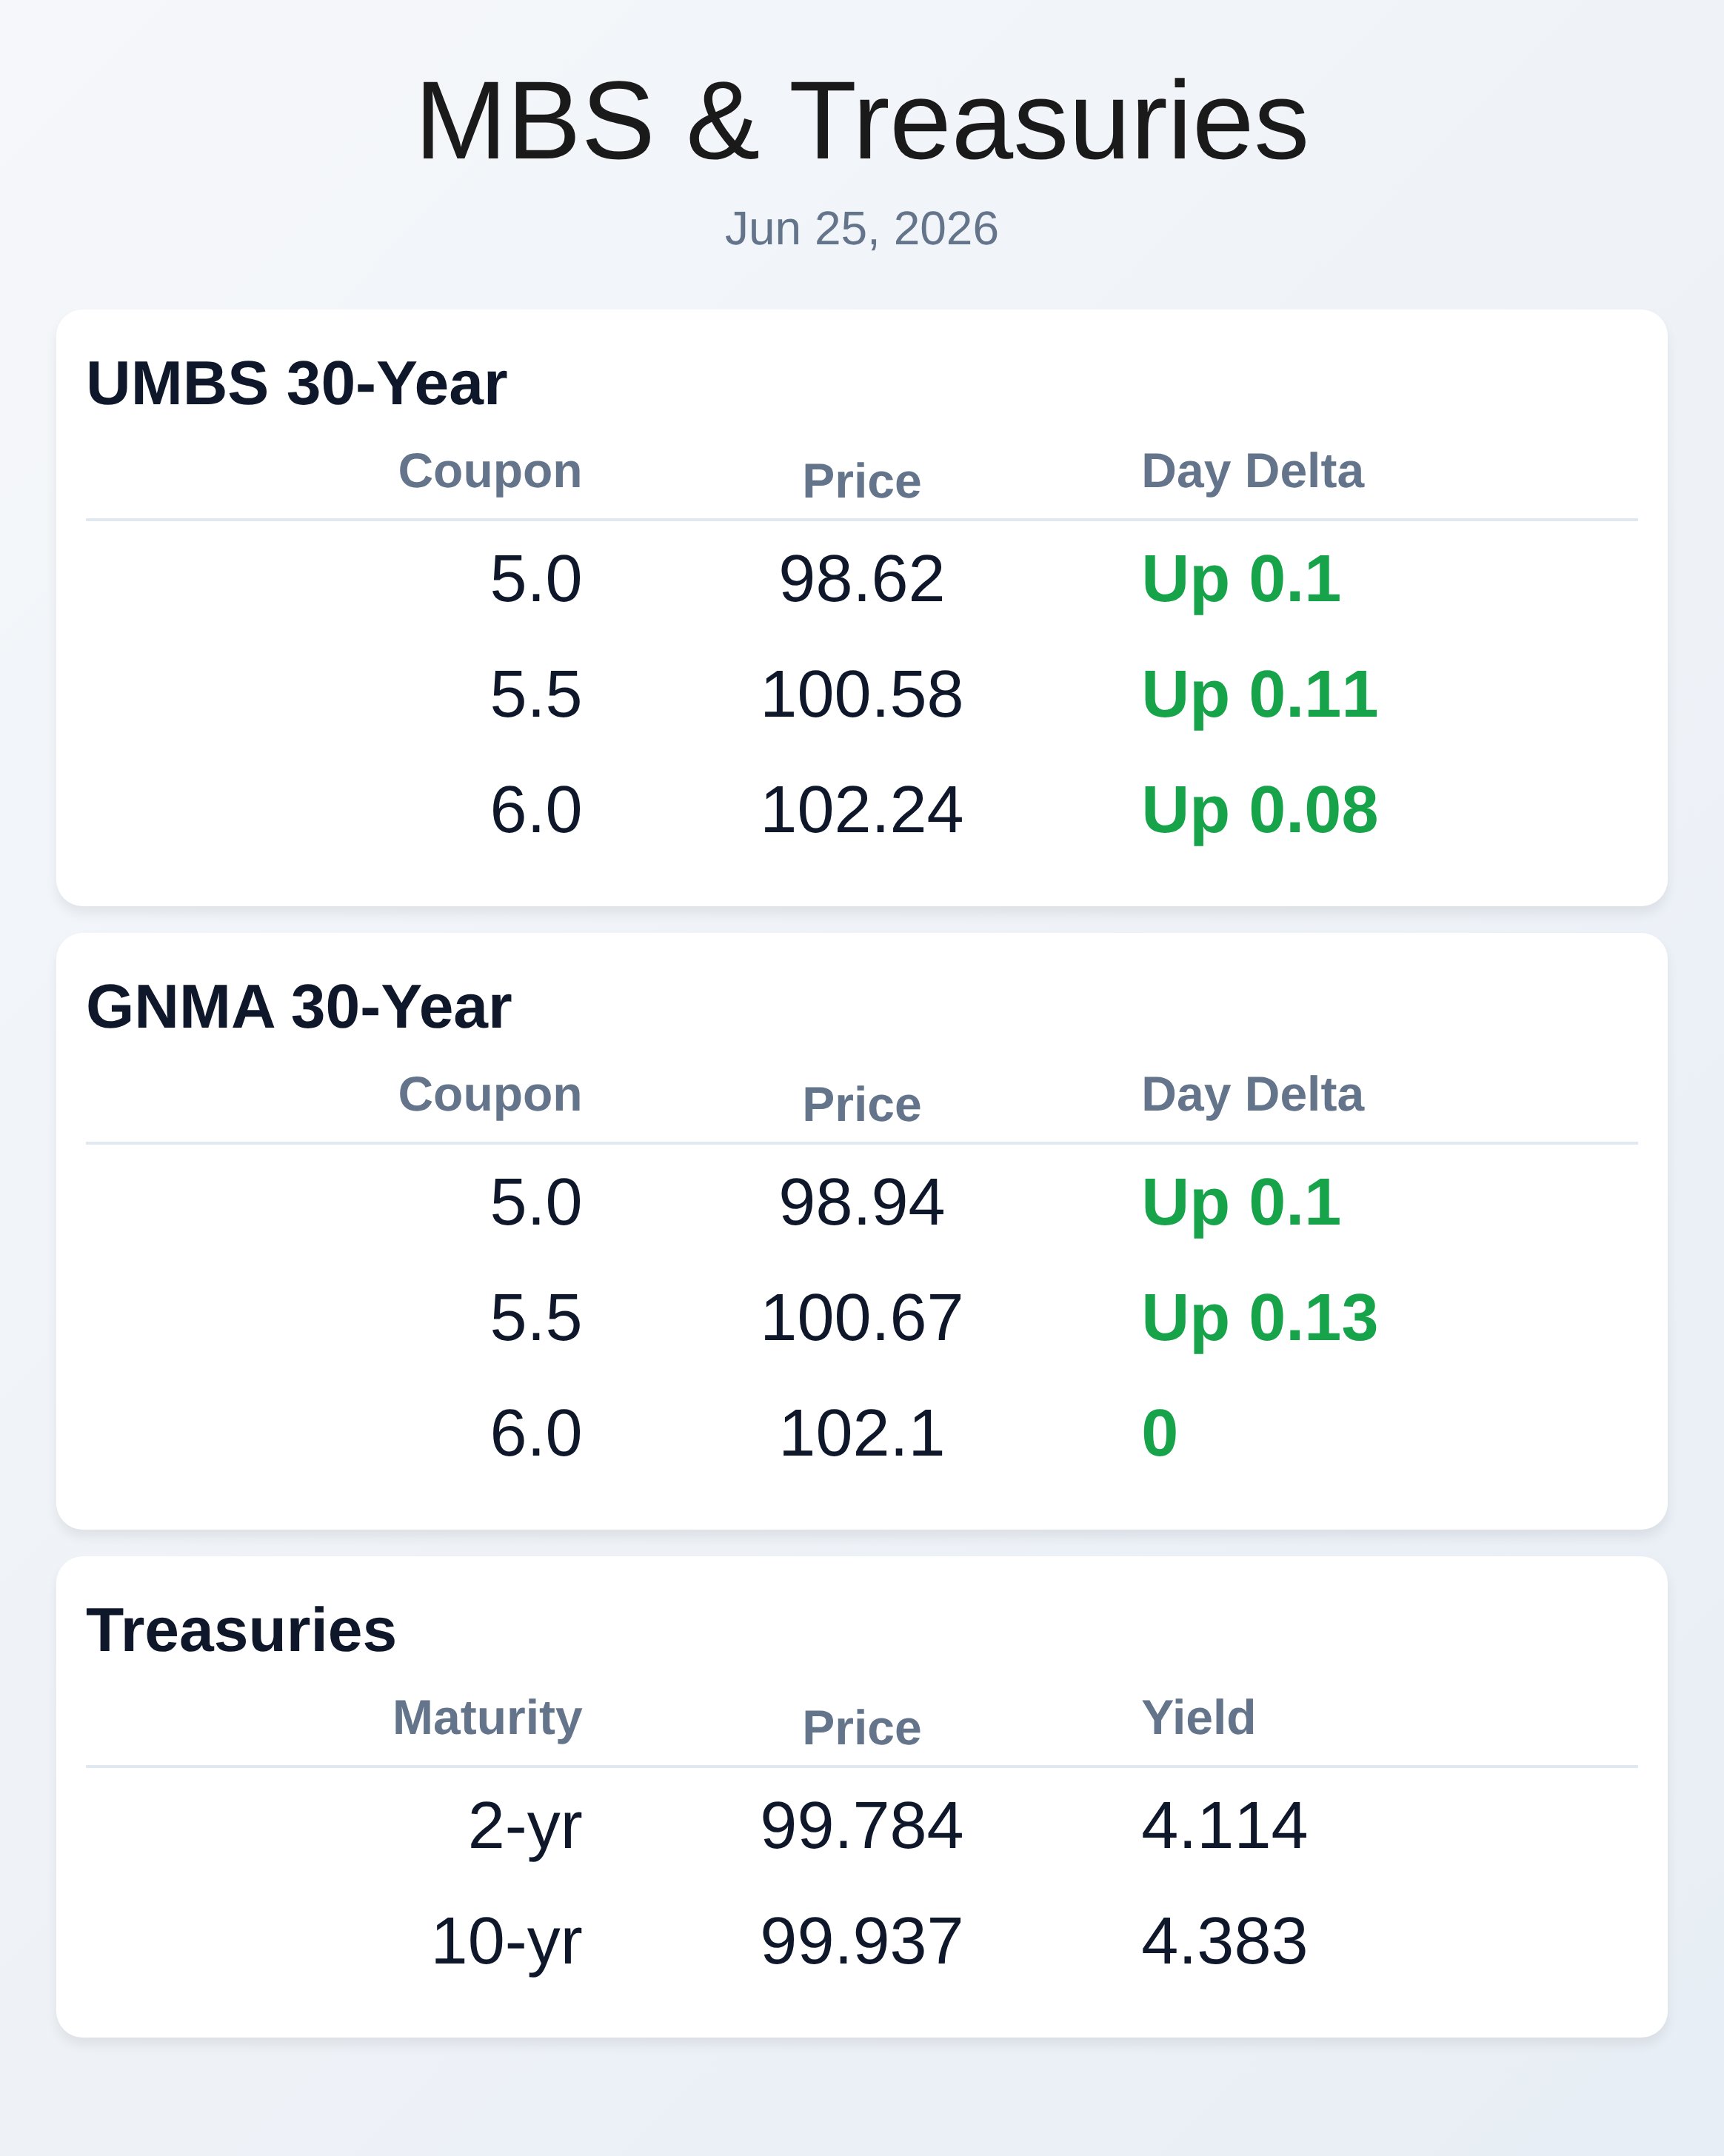
June 25, 2026
RECENT ARTICLES

Champions are broken people. They don’t generally have the most admirable internal states, by Alex Homozi
Reading Notes For: Champions are broken people. They don’t generally have the most admirable internal states. People look at champions and try to identify qualities that the champion has that they [...]
What’s up in Mortgage Today – 7.10.23
MBS up 28 bps on the morning. Stocks up 10.5. It's a characteristically slow summertime Monday morning and bonds are left to trade without any meaningful market movers. Such conditions often result in [...]
China is in Default On $1T in Debt. What does that mean for the US?
The Potential Impact of China's Debt Crisis on the American Economy Introduction: The world has been closely monitoring China's growing debt crisis, which has raised concerns about its potential impact on the global economy. [...]
Article Archive
