The Fed’s Rate Playbook: What 60 Years of Inflation Fights Mean for Your Pipeline
Why This Matters to Your Business Right Now
If you originate mortgages, you have watched the Federal Reserve raise rates aggressively over the past two years, and you have felt the direct impact on your pipeline. Rates climbed faster than most forecasters expected, applications fell, and the refinance market nearly vanished. Now the question every loan officer and broker is asking: how much higher do rates need to go, and how long will they stay there?
History offers a framework. Since 1966, the Federal Reserve has undertaken 12 distinct campaigns to bring down inflation by at least one percentage point. On average, those campaigns required the Fed to raise its policy rate by about 200 basis points—two full percentage points—from the start of the tightening cycle until inflation fell by 100 basis points. The range, however, was enormous: in 2016–2017, the Fed needed only 60 basis points of rate increases to achieve that result, while in 1979–1980, it took 640 basis points. That variation tells us that the economic environment, inflation’s root causes, and the Fed’s credibility all shape how much tightening is necessary.
Understanding these historical patterns will not give you a crystal ball, but it will give you a more grounded way to talk with clients, set realistic expectations about rate direction, and plan your business for what may be a longer period of elevated rates than many borrowers—and some economists—currently anticipate.
The 12 Inflation-Fighting Cycles Since 1966
The Federal Reserve does not publish an official list labeled “inflation-fighting cycles,” but economists and market analysts have identified 12 distinct periods since 1966 in which the Fed raised its policy rate with the explicit or implicit goal of reducing inflation by at least one percentage point, measured by the Consumer Price Index. These cycles varied widely in duration, in the speed of rate increases, and in the economic conditions that surrounded them.
Some cycles occurred during oil shocks, when supply disruptions pushed energy prices sharply higher and inflation spread through the economy. Others took place during periods of strong demand growth, when low unemployment and rising wages put upward pressure on prices. Still others followed periods of easy monetary policy that had allowed inflation expectations to drift higher. Each cycle required the Fed to judge how much tightening would be enough to cool demand without triggering a severe recession.
The 12 cycles span nearly 60 years of economic history, covering the end of the Bretton Woods system, the stagflation of the 1970s, the Volcker-era inflation fight, the expansion of the 1990s, the housing boom and bust, the Great Recession, and the post-pandemic surge in prices. No two cycles were identical, but together they reveal patterns that can inform how we think about the current environment.
The Average: 200 Basis Points to Reduce Inflation by One Percentage Point
When you average the 12 cycles, the Fed raised its policy rate by roughly 200 basis points from the start of tightening until inflation fell by at least 100 basis points. That average is a useful benchmark, but it conceals significant variation. In some cycles, the Fed achieved the inflation reduction with far less tightening. In others, it needed to push rates much higher and hold them there longer.
For mortgage professionals, the 200-basis-point average is a reminder that cooling inflation is not a quick process. If the Fed began this current cycle with its policy rate near zero and inflation running above 8 percent at the peak, bringing inflation down to the 2 percent target—a six-percentage-point reduction—would require sustained tightening. Even if the Fed achieves better-than-average efficiency, the historical record suggests that rates may need to remain elevated for an extended period.
The average also underscores that the Fed cannot simply declare victory after a few months of declining inflation. In several past cycles, inflation fell initially but then re-accelerated when the Fed eased policy too soon. The central bank learned from those episodes that credibility and follow-through matter. Once inflation expectations become unanchored, it takes more work—and more rate increases—to bring them back down.
The Extremes: 60 Basis Points in 2016–2017 Versus 640 in 1979–1980
The range of rate increases required in past cycles is striking. At the low end, the 2016–2017 cycle saw the Fed raise rates by only about 60 basis points before inflation fell by one percentage point. At the high end, the 1979–1980 cycle demanded 640 basis points of tightening—more than ten times as much.
Why such a wide spread? In 2016–2017, inflation was low and stable, inflation expectations were well-anchored, and the Fed’s credibility was high. The economy was growing, but not overheating. A modest amount of tightening was enough to keep inflation in check. In contrast, the late 1970s saw double-digit inflation, deeply entrenched inflation expectations, and a loss of confidence in the Fed’s willingness to act. Households and businesses expected prices to keep rising, and that expectation became self-fulfilling. It took dramatic, painful rate increases—and a severe recession—to break the cycle.
For originators, the lesson is that context matters enormously. If inflation is driven by temporary supply shocks and expectations remain anchored, the Fed may not need to push rates as high. But if inflation becomes embedded in wage-setting and pricing decisions, the Fed will have to do much more. The current cycle shows signs of both supply-driven and demand-driven inflation, and inflation expectations have risen. That suggests the Fed’s task today looks more like the middle or upper end of the historical range than the easy 2016–2017 experience.
What CPI and Core Inflation Tell Us
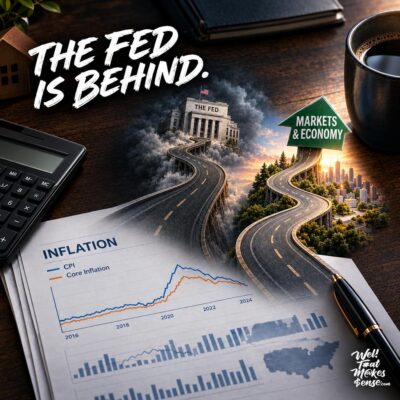
The Consumer Price Index measures the change in prices paid by consumers for a basket of goods and services. It includes everything from gasoline and groceries to rent and medical care. CPI is the headline number that gets reported in the news and shapes public perception of inflation. But the Fed also watches Core CPI closely. Core CPI excludes food and energy prices, which can be volatile and driven by factors outside the Fed’s control, such as weather or geopolitical events.
Core inflation tends to be stickier than headline inflation. It reflects underlying demand pressures and wage growth, and it is slower to respond to changes in monetary policy. In several of the 12 historical cycles, headline CPI fell relatively quickly when oil prices dropped or supply chains normalized, but Core CPI remained elevated. That stickiness forced the Fed to keep rates higher for longer, even as some observers argued that the inflation problem was solved.
In the current cycle, Core CPI has declined from its peak but remains well above the Fed’s 2 percent target. Services inflation, which is heavily influenced by wages, has been particularly persistent. For mortgage professionals, this means that even if headline inflation continues to fall—perhaps due to lower gasoline prices or easing supply-chain pressures—the Fed is unlikely to cut rates aggressively until Core CPI is clearly on a path back to target. That path could take longer than many borrowers expect.
The Fed’s Dual Mandate and the Inflation Priority
The Federal Reserve operates under a dual mandate: to promote maximum employment and to maintain stable prices. In normal times, the Fed tries to balance these two goals. But when inflation runs well above target, the Fed shifts its focus. History shows that the central bank is willing to accept higher unemployment and slower growth if that is what it takes to bring inflation down.
This prioritization has important implications for mortgage demand. When the Fed raises rates to fight inflation, borrowing costs rise across the economy. Mortgage rates climb, housing affordability falls, and fewer buyers can qualify for loans. Purchase applications drop, and refinance volume collapses. Originators see their pipelines shrink, and many leave the industry.
The Fed understands these consequences, but it views them as necessary to prevent a more damaging outcome: entrenched inflation that erodes purchasing power, distorts investment decisions, and eventually requires even more painful tightening. In the 12 historical cycles, the Fed accepted recessions in several cases because it judged that the long-term cost of inaction was higher. That same calculus is at work today.
How Long Rate Increases Took to Reduce Inflation
The time lag between the start of Fed rate increases and a measurable decline in inflation varies by cycle. Monetary policy works with long and variable lags, as economists say. When the Fed raises rates, it takes months for those higher rates to filter through the economy, cool demand, and bring down price growth.
In some cycles, inflation began to fall within six to nine months of the first rate hike. In others, it took 18 months or more. The variation depends on the nature of the inflation, the state of the economy, and how quickly inflation expectations adjust. Supply-driven inflation can reverse quickly if supply constraints ease. Demand-driven inflation, fueled by strong wage growth and high employment, takes longer to cool because it requires a sustained slowdown in economic activity.
For mortgage professionals, this lag means that even after the Fed stops raising rates, inflation may remain elevated for some time. And even after inflation starts to fall, the Fed is likely to keep rates high until it is confident that inflation is durably back to target. That suggests a prolonged period of elevated mortgage rates, which in turn means originators need to plan for a lower-volume environment and focus on purchase business, builder relationships, and non-traditional products that meet the needs of buyers in a high-rate world.
What “More Work to Do” Means in Practice
When analysts say the Fed has “a lot more work to do,” they mean that current policy rates may not yet be high enough to bring inflation all the way back to the 2 percent target, or that rates may need to stay elevated longer than markets expect. The historical average of 200 basis points to reduce inflation by one percentage point provides a rough guide, but the current cycle started with inflation much higher than in most past cycles.
If inflation peaked above 9 percent and the Fed’s target is 2 percent, the required reduction is about 7 percentage points. Applying the historical average would suggest the Fed needs to raise rates by roughly 1,400 basis points from the start of the cycle. The Fed has already raised rates significantly from near zero, but inflation remains above 3 percent. That gap suggests the Fed may need to keep rates at current levels—or even raise them further—until inflation falls closer to target.
For originators, “more work to do” translates into a longer period of elevated mortgage rates and constrained refinance activity. It also means that any expectation of rapid rate cuts in the near term is likely misplaced. The Fed has signaled that it will not ease policy until it sees sustained progress on inflation, and history shows that premature easing can allow inflation to re-accelerate.
Let’s Connect
- Subscribe for more plain-English breakdowns like this one: www.WellThatMakesSense.com