**WTMS Blog Today = What’s up in Mortgage Today (AM) – 08/11/2026**
Oil-driven volatility continues to dominate mortgage markets as geopolitical tensions cloud the economic outlook and push bond yields higher. The 10-year Treasury yield ticked up seven basis points to 4.71%, reversing Monday’s brief decline as Iran negotiations stall and crude prices remain elevated. Agency MBS securities show mixed signals, with UMBS 6.0 coupons gaining ground while lower coupons stumbled, reflecting the uneven impact of curve bear steepening.
Issuance resilience persists, with July MBS supply hitting $110.9 billion—the fifth consecutive month above $100 billion—despite cooling housing activity. Traders remain cautious, knowing another headline shift could trigger sharp repricing across the yield curve. Mortgage origination volume continues its summer weakness as higher rates weigh on purchase demand and refinance incentives evaporate.
July funded volume fell 7% month-over-month, with the average 30-year conforming retail rate at 6.42%—up eight basis points from June. Household leverage sits at elevated levels despite recent debt-to-income improvements, signaling borrowers are stretched even as home price appreciation moderates. Prepayment speeds remain subdued at 8.1% CPR, with only 3.6% of outstanding mortgages holding any refinance incentive.
This stalled refi market continues to hurt originators hoping for a volume recovery but supports mortgage servicing portfolios. Subservicing partnerships have become strategic battlegrounds, with borrower experience now outranking price as the primary selection criterion for lenders evaluating provider changes. STRATMOR’s latest survey of 68 lenders managing 9.8 million loans reveals that 83.3% of users prefer a single subservicing partner and over 70% want providers that don’t compete for future originations.
Specialized capabilities—particularly HELOC expertise, fraud controls, predictive modeling, and seamless digital integration—increasingly determine partnership decisions. This shift reflects the industry’s recognition that operational stability and borrower satisfaction drive profitability more reliably than low pricing alone. Lenders should now evaluate total cost of ownership rather than headline rates when selecting subservicing partners.
Home equity extraction is emerging as a core growth lever for mortgage originators seeking to offset declining purchase volume and refi activity. Trillions in tappable equity and borrowers locked into low first-lien rates create ideal conditions for HELOC origination and portfolio growth. However, success requires strong buy boxes, fast closing speeds, and processing teams dedicated to saving complex files.
Originators offering streamlined digital HELOC solutions with dedicated client success teams are transforming what was once an operational headache into a primary growth engine. This strategy directly defends existing client relationships while capturing immediate volume in a challenging origination environment.
**Locking vs Floating**
Recent volatility around geopolitical headlines—particularly oil price swings tied to Iran negotiations—creates unpredictable daily risk for rate locks.
Yields remain closer to long-term ceilings, leaving risk-tolerant borrowers with less upside cushion to justify floating rate exposure. Friday presented a solid lock opportunity, but today’s market structure offers minimal additional advantage for either strategy. Peace prospects or inflation data would need to improve dramatically to meaningfully shift the lock-versus-float calculus.
**Today’s Events**
10-year Treasury yields opened at 4.71% after a seven-basis-point overnight move. NFIB Small Business Optimism Index released at 99.8, marking its highest level since August 2025. Existing Home Sales data expected at 4.07 million units.
A $58 billion three-year Treasury note auction concludes today’s economic calendar.
**Bond Pricing**
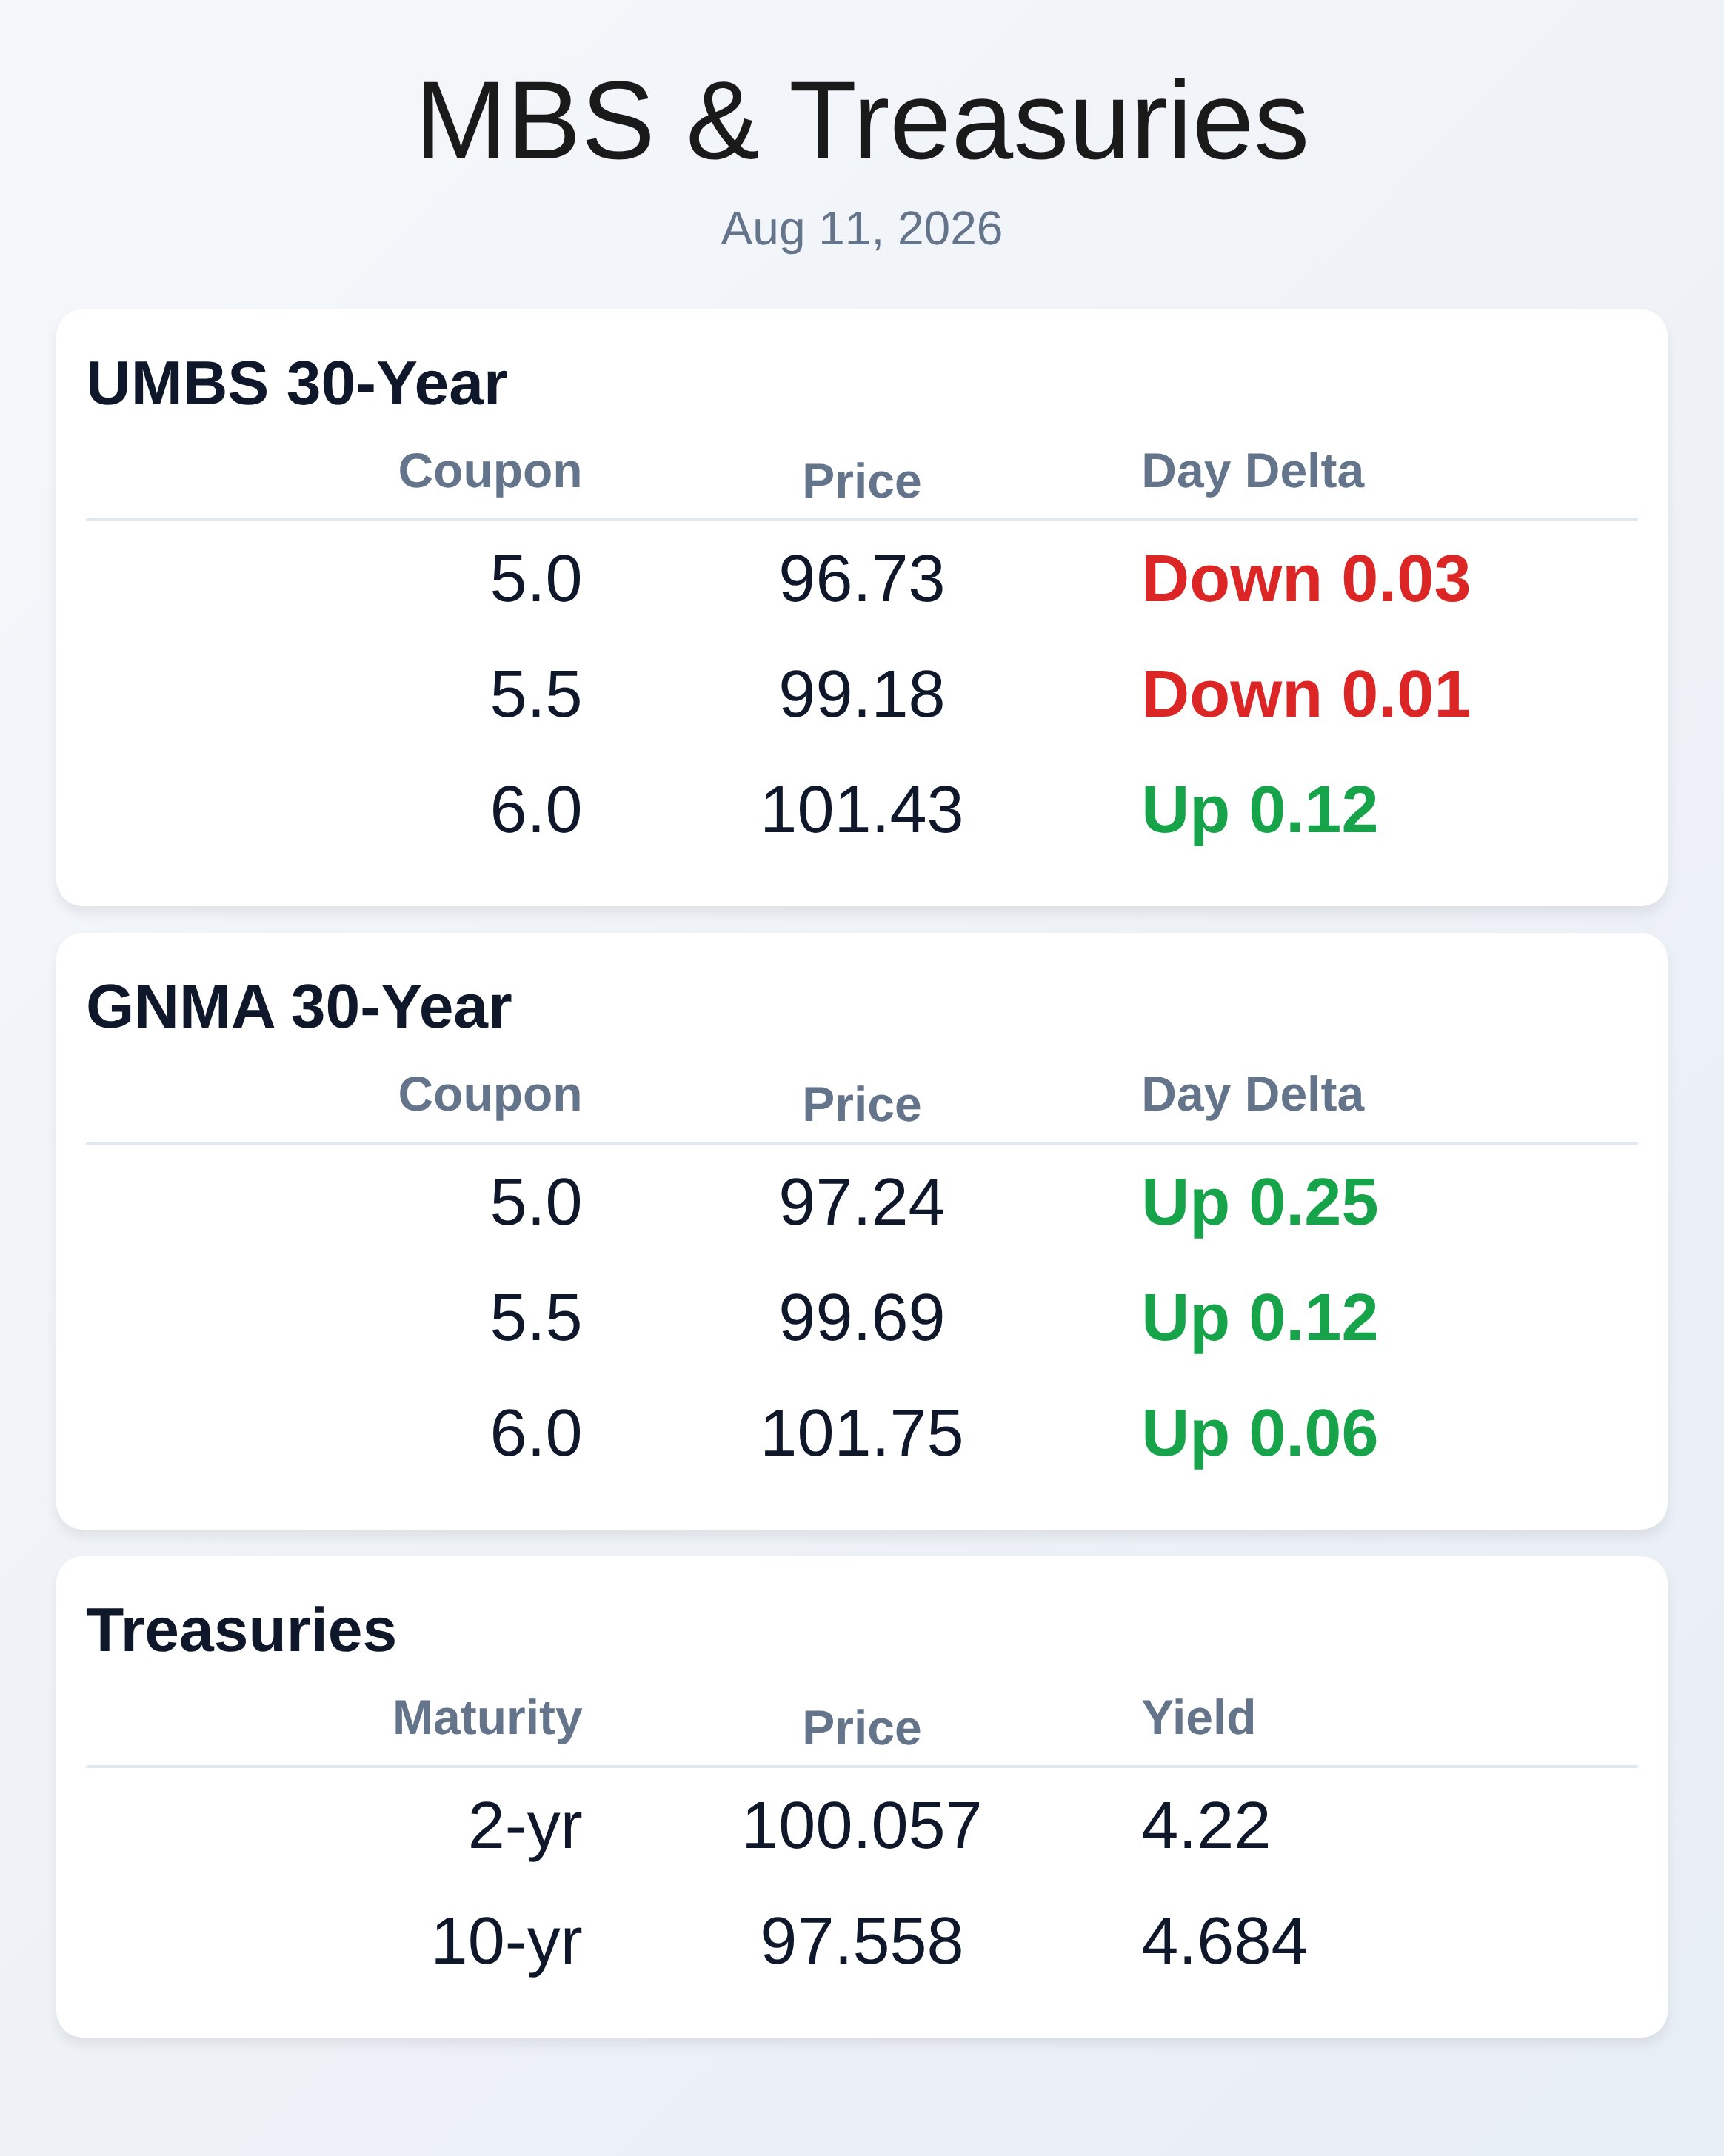
**UMBS 30 yr**
| Coupon | Price | Intra-Day Change |
| 5.0 | 96.73 | -0.03 |
| 5.5 | 99.18 | -0.01 |
| 6.0 | 101.43 | 0.12 |
**GNMA 30 yr**
| Coupon | Price | Intra-Day Change |
| 5.0 | 97.24 | 0.25 |
| 5.5 | 99.69 | 0.12 |
| 6.0 | 101.75 | 0.06 |
**Treasuries**
| Term | Yield | Price | Intra-Day Yield Change |
| 2 yr | 4.22 | 100.057 | -0.021 |
| 3 yr | 4.286 | 99.551 | -0.022 |
| 5 yr | 4.384 | 99.962 | -0.024 |
| 7 yr | 4.529 | 99.084 | -0.025 |
| 10 yr | 4.684 | 97.558 | -0.021 |
| 30 yr | 5.236 | 96.449 | -0.014 |