**WTMS Blog Today = What’s up in Mortgage Today (AM) – 08/19/2026**
Bonds turned green today after Treasury Secretary Bessent shocked markets with an unexpected doubling of debt buyback operations across the 10-year to 30-year sector. The 30-year yield dropped nearly 10 basis points to 5.185% from its highest level since 2007, pulling the broader long end back from its most vulnerable point. This move signals Washington is actively fighting the Treasury selloff that has plagued markets since last Friday as geopolitical tensions and AI investment boom concerns push nominal yields higher.
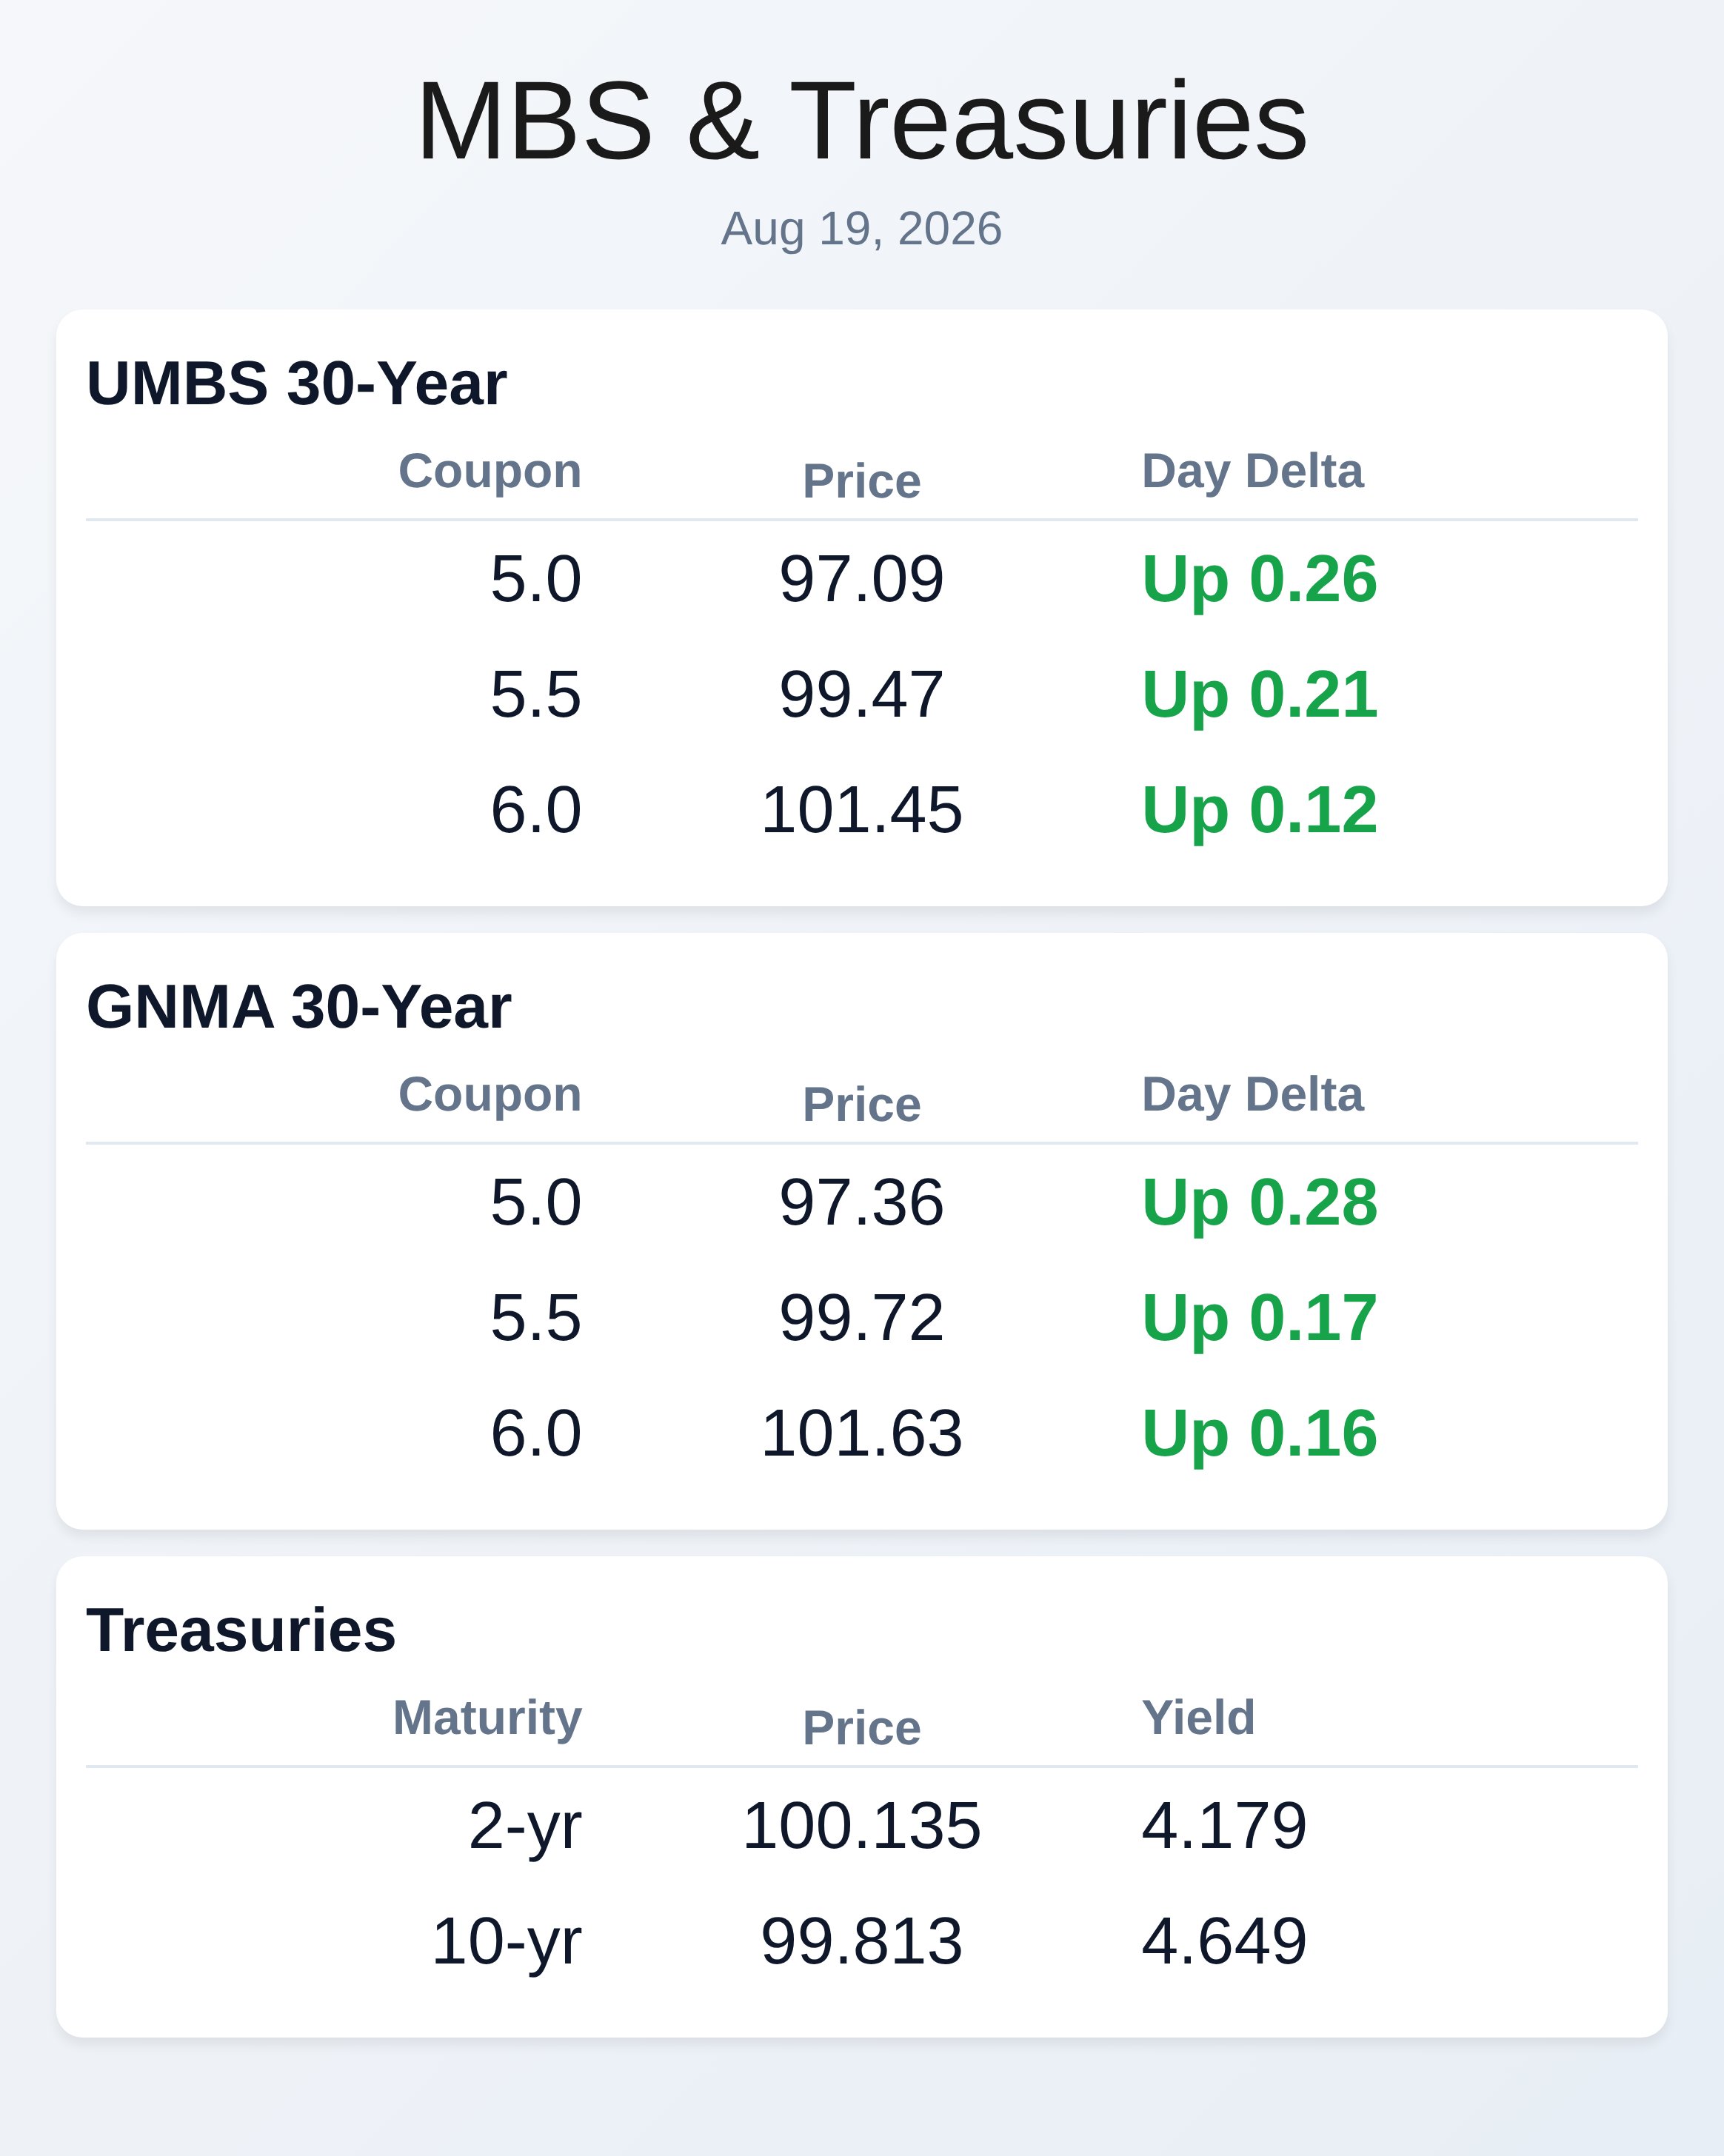
UMBS 5.5% securities rallied to 99.47 with intraday gains of 21 basis points, while GNMA equivalents moved to 99.72 with 17 basis points of improvement. The buyback announcement marks an important circuit-breaker moment in what has been a brutal week for long-duration bonds. Housing data released today painted a picture of demand destruction under the weight of elevated mortgage rates, directly pressuring the origination market mortgage sellers serve.
July housing starts plunged 12.4% to a 1.24 million annualized pace with single-family declines across every region, while pending home sales fell 2.3%, a larger miss than expected. Building permits offered modest encouragement with a 5% increase including 2.5% gains in single-family permits, but the damage to current month starts is unmistakable and confirms rates are crushing purchase activity. MBA mortgage applications fell 0.4% last week despite a 2% refinance uptick, as a 2% purchase decline dominated the headline.
For originators, this means continued pressure on volume even as profit margins stabilize near $973 per loan in Q2 2026, up from $727 in Q1. The 10-year Treasury yield closed at 4.65% late yesterday and opened today at 4.692% before sliding to 4.649% following the buyback announcement, establishing a trading range that will anchor both primary and secondary mortgage markets. The 2-year held at 4.179%, maintaining the flatter front end that reflects diminished expectations for a September Fed hike despite elevated uncertainty over the Fed’s reaction function under new leadership.
The Fed’s July minutes arriving later today are expected to show hawkish sentiment on inflation remains broad-based across the committee, though recent softness in payrolls, retail sales, and price pressures has reduced immediate rate-hike probability to roughly one-in-three. Market participants are pricing approximately 50% odds of an October hike and 90% odds by December, creating tension that keeps rates volatile. Until August inflation data arrives, the bias remains toward higher long-end yields absent a deterioration in equities or economic growth.
Mortgage bankers saw profits recover meaningfully in Q2 2026, with independent mortgage banks earning an average $973 per loan in pre-tax production profit compared to $727 in Q1, marking the fifth consecutive profitable quarter. However, per-loan production costs remain stubbornly high at $10,936 despite declining from $11,898 in Q1, reflecting a structural reality that loan-manufacturing expenses have doubled from the $7,945 average between 2008 and today. The average production revenue was $11,909 per loan, down from $12,626, indicating margin compression remains an ongoing challenge even as overall origination economics improve.
Roughly 85% of the 330-plus mortgage companies surveyed posted overall profits when combining production and servicing operations, a stark contrast to losses that plagued the industry between 2022 and 2024. For sellers focused on per-loan economics, the message is clear: costs are sticky and remain a competitive pressure point that technology investments must address. Iran-related geopolitical tensions continue to underpin elevated crude oil prices and create overnight float risk that remains unmanageable for rate-risk managers across the mortgage desk.
Oil prices held near $85.55 per barrel intraday with Brent approaching $92, a dynamic that keeps inflation expectations elevated and bond market participants defensive despite Treasury intervention efforts. As long as Middle East instability persists, overnight floating strategies carry perpetual risk and push lenders toward lock-heavy positioning unless basis risk on TBA hedges becomes unacceptable. The recent strong stock-market performance and ongoing AI investment continue to support risk appetite, but the equation has turned less favorable as higher discount rates without corresponding earnings growth leave equities on shakier footing.
This tension between inflation expectations and recession fears is the backdrop keeping both the housing market and the rate environment unsettled. FOMC minutes due later today will provide clarity on the inflation battle that has become the Fed’s primary concern after policymakers voted 9-3 to hold rates steady at their July meeting. Officials are seeking clearer evidence of declining core inflation before ruling out a September or October hike, though recent CPI and PPI softness has eased near-term pressure somewhat.
A 20-year Treasury auction scheduled for 1 p.m. Eastern time and a 4-month auction at 11:30 a.m. will test investor appetite in the face of higher supply and elevated yields.
Oil inventory data arriving later today provides another inflation read that will influence market direction into the afternoon close. Subscribe free to WellThatMakesSense.com to stay on top of mortgage market signals and lending business trends.
**Locking vs Floating**
Overnight floating remains a dangerous strategy as long as Iran-related geopolitical tensions keep crude oil prices elevated and inflation expectations supported.
The bond market has made meaningful progress only rarely this week, and higher fuel prices ensure the upside bias in long-term yields persists. MBS intraday price action helps originators manage short-term risk, but the 10-year Treasury yield ceiling and floor levels are the key measures of longer-term bond market momentum you should monitor for portfolio positioning.
**Bond Pricing**
**UMBS 30 yr**
| Coupon | Price | Intra-Day Change |
| 5.0 | 97.09 | 0.26 |
| 5.5 | 99.47 | 0.21 |
| 6.0 | 101.45 | 0.12 |
**GNMA 30 yr**
| Coupon | Price | Intra-Day Change |
| 5.0 | 97.36 | 0.28 |
| 5.5 | 99.72 | 0.17 |
| 6.0 | 101.63 | 0.16 |
**Treasuries**
| Term | Yield | Price | Intra-Day Yield Change |
| 2 yr | 4.179 | 100.135 | 0.015 |
| 3 yr | 4.247 | 100.008 | -0.001 |
| 5 yr | 4.344 | 100.138 | -0.014 |
| 7 yr | 4.479 | 99.381 | -0.044 |
| 10 yr | 4.649 | 99.813 | -0.057 |
| 30 yr | 5.195 | 98.939 | -0.086 |