**WTMS Blog Today = What’s up in Mortgage Today (PM) – 09/30/2026**
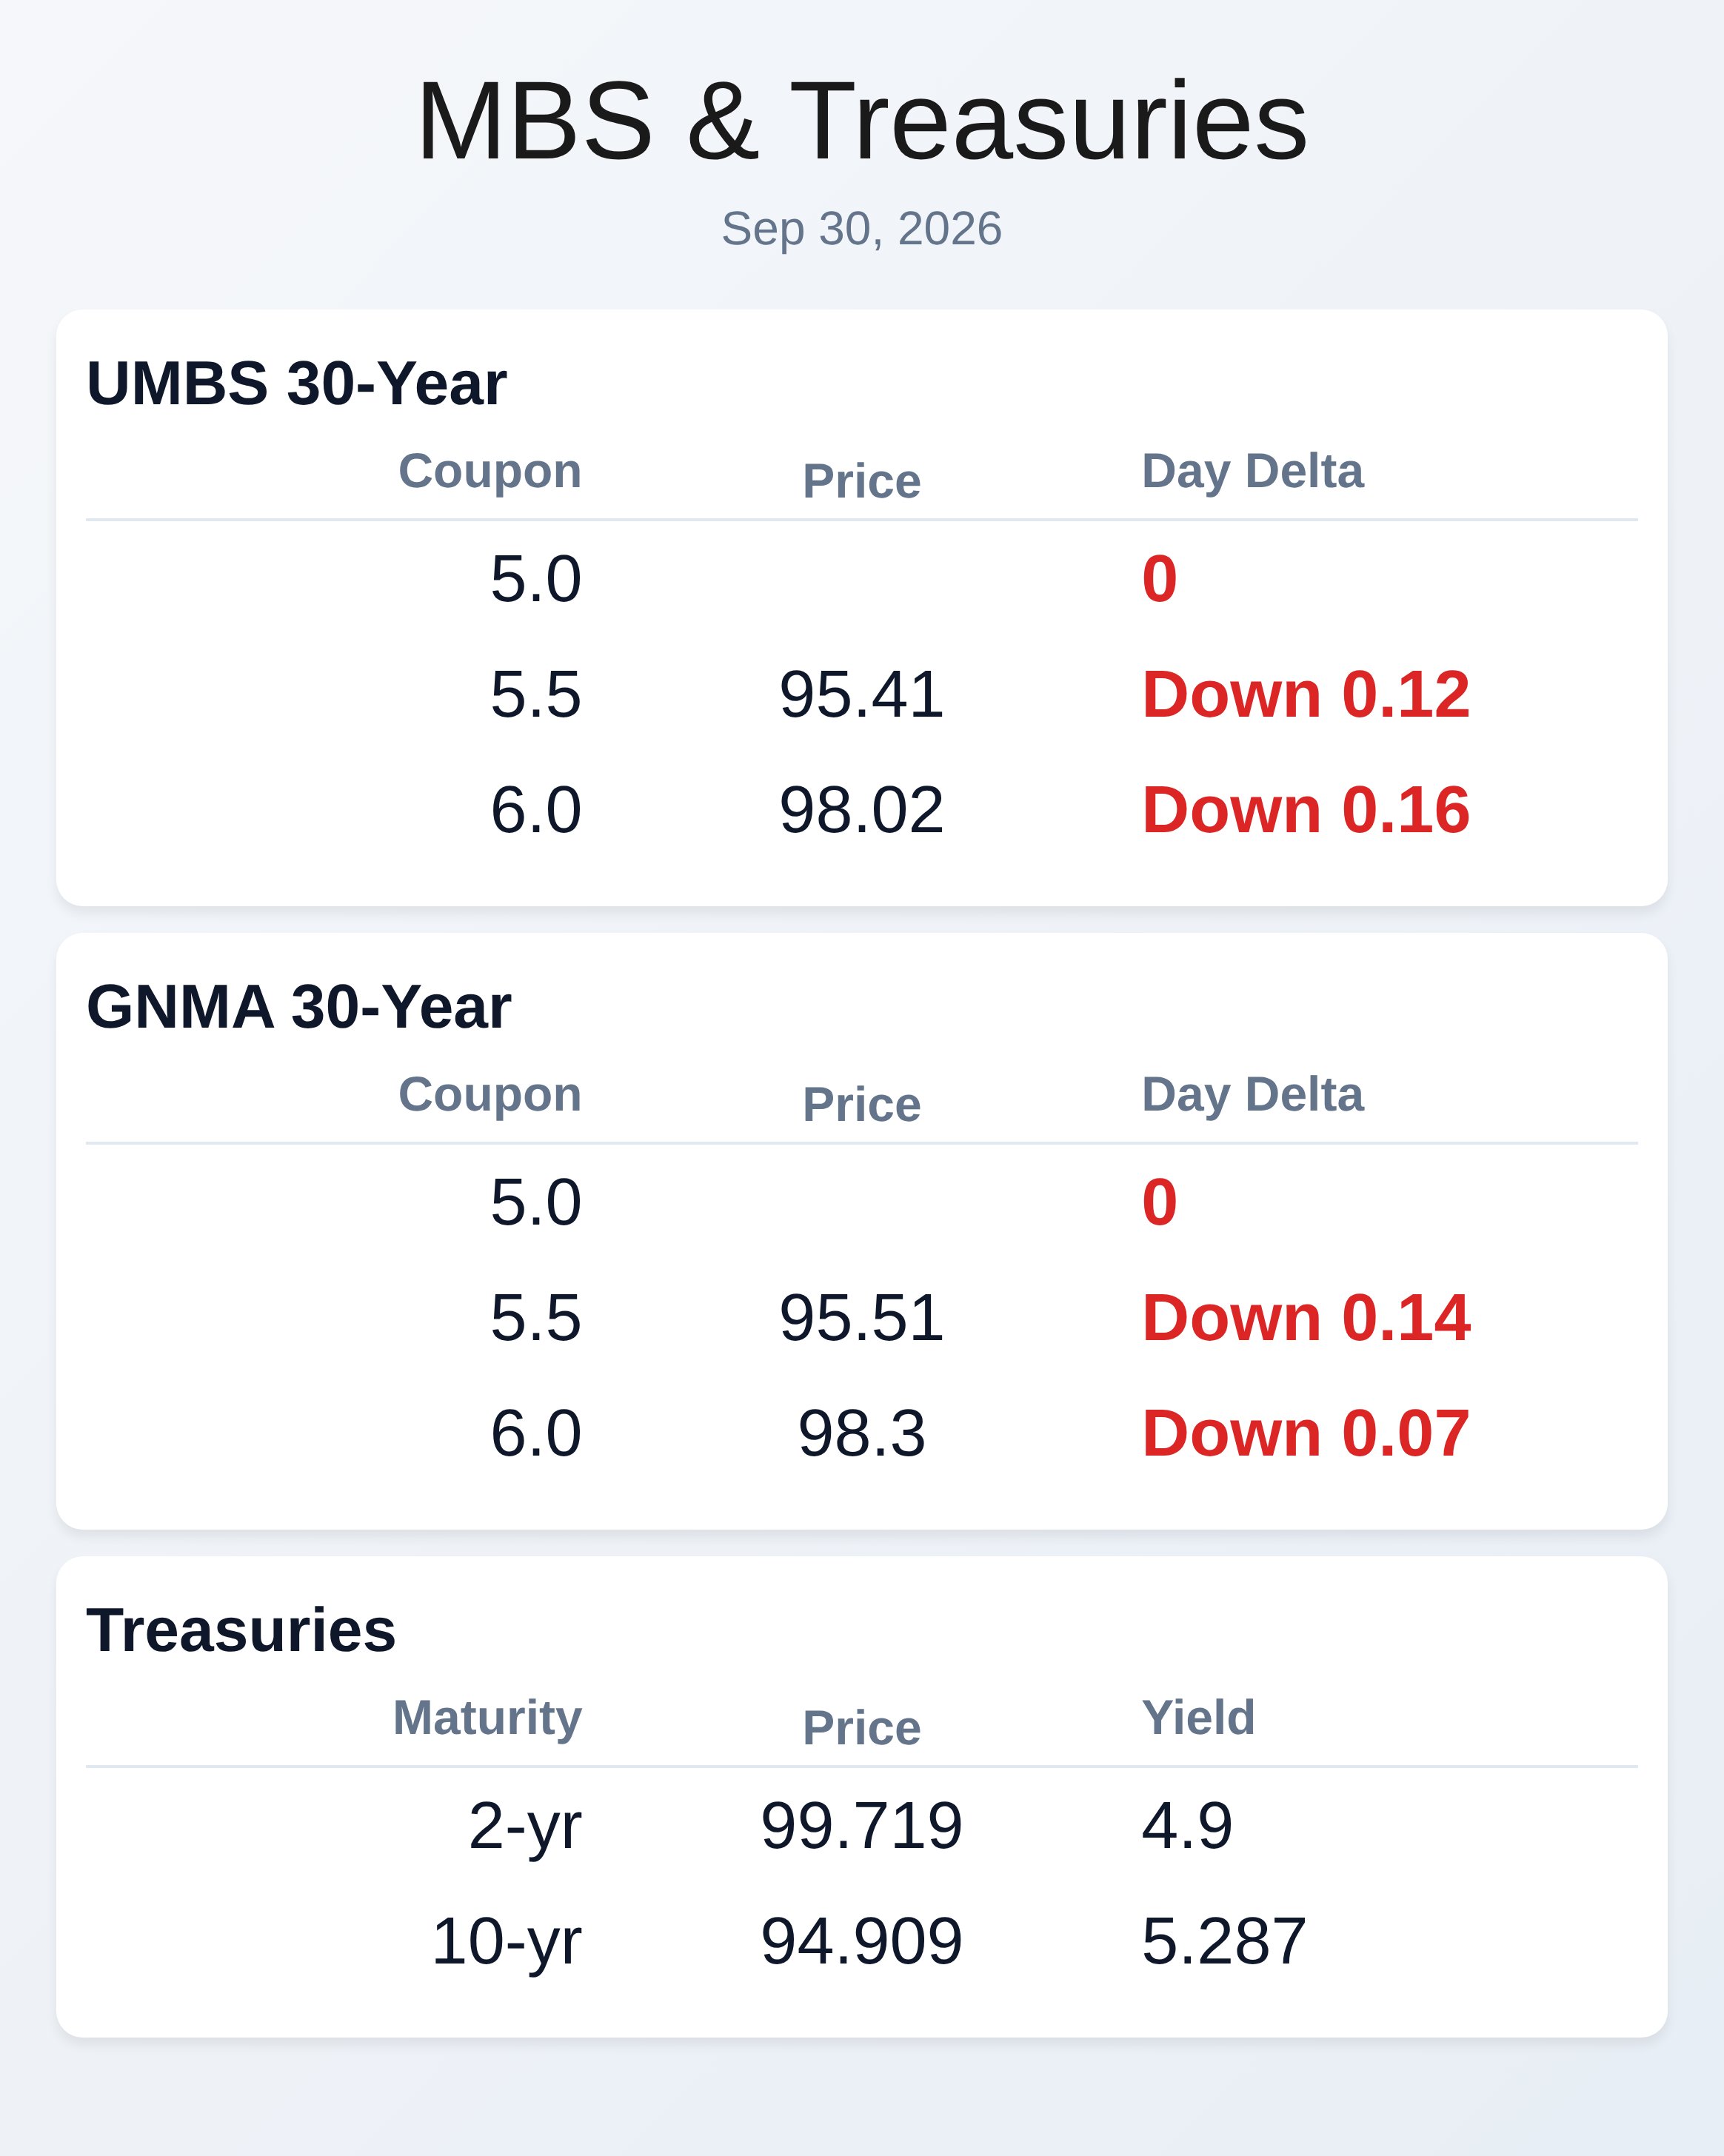
Bonds sold off sharply today without a clear catalyst, pushing 10-year Treasuries to 5.29% and forcing most lenders into reprice territory by midday. PCE inflation data came in cooler than expected this morning, but that brief rally evaporated as month-end and quarter-end dynamics took over. The MBS market moved down a quarter point from early morning rate sheet times, creating genuine pain for borrowers locked in recent days.
Most mortgage originators are now weighing whether to hold the line on pricing or accept additional losses on their pipelines. Broader econ strength—GDP beat, ADP jobs higher than forecast—appears to be winning the narrative over cooling inflation. The messaging to borrowers about rate direction remains murky heading into Thursday and Friday when critical employment data hits.
Month-end mechanical selling, potential portfolio rebalancing, and rumors of geopolitical escalation are layered on top of genuine economic data divergence. MBS Live analysts suggest waiting for a market rally that isn’t driven by heavy selling pressure before making lock/float adjustments. If Thursday brings weak jobs or wage data, mortgage rates could stage a substantial recovery; however, stronger numbers would only reinforce today’s upward momentum.
Risk managers should assume reprice alerts could continue through the week. The appraisal community got a six-month reprieve today when the GSEs delayed the UAD 3.6 mandate from November 2 to May 19, 2027, giving the entire mortgage ecosystem time to catch up. The mortgage industry was sleepwalking toward compliance with less than a month remaining, and most appraisers hadn’t completed even one 3.6 form.
Software vendors like ACI Sky Workbench and Cotality’s TOTAL had unfinished development roadmaps, while many lenders were still running legacy LOS systems incompatible with the new standard. The silver lining: business volume is weak, so appraisers have time to learn workflows without handling a crisis volume surge simultaneously. Expect the industry to use this runway more wisely than the first nine months since January’s production launch.
Credit scoring competition intensified today when FHFA announced Fannie Mae and Freddie Mac will now apply a single pricing grid for both Classic FICO and VantageScore 4.0 loans, eliminating the 20-point penalty that previously existed. Rocket Mortgage made VantageScore its default credit model starting Q4, having already moved 44.1% of August retail issuance to the alternative score after pulling 1.4 million dual reports. The competitive dynamic is creating meaningful borrower savings—UWM reports 25% of borrowers see better results with VantageScore, while Rocket found qualifying borrowers saved an average of $1,600 at closing.
However, Fannie and Freddie’s quiet disclosure of proprietary “Fannie Score” and “Freddie Score” signals that GSE-owned algorithms could eventually compete directly with FICO and VantageScore in the future. This three-way (or four-way) score competition reshapes origination economics and borrower eligibility outcomes. Thirty-year mortgage rates climbed to 7.30% this week, the highest level since November 2023, marking six consecutive weeks of increases.
Total mortgage applications fell 6% as higher borrowing costs pushed purchase and refi applications down 4% and 9% respectively, with refis now 56% below year-ago levels. ARM adoption jumped to 10.3% of applications—the highest share since October 2025—as some borrowers scramble for rate relief in a higher-for-longer environment. Price cuts on listings nationwide hit 20.8%, up nearly 1 percentage point year-over-year, signaling seller capitulation.
Rates continued climbing through the end of the month, reaching 7.58% by Tuesday. Mortgage originators face operational strain as Eleven Mortgage exited wholesale and correspondent lending after eight years, redirecting its parent company Benchmark’s resources solely to retail. The broader organization saw producing workforce decline 32% over the past year, from 245 to 167 originators, reflecting industry contraction.
Multiple wholesale lenders have quietly tightened capacity or shuttered divisions as loan volume remains depressed and competition for borrowers intensifies. Tech vendors are racing to prove value in a softer market, while the ICE Residential Whole Loan Evaluations service launched today to address secondary market pricing opacity. Originators should assume continued consolidation and channel rebalancing until application volume recovers significantly above current levels.
**Locking vs Floating**
MBS Live recommends waiting until the bond market shows genuine strength independent of panic selling before adjusting lock or float positioning. While cooler PCE data hints at potential Fed patience, stronger-than-expected GDP and ADP jobs readings suggest the inflation fight remains contested. Any meaningful mortgage rate recovery would likely depend on weak employment reports arriving Thursday or Friday; conversely, strong labor data would likely accelerate the recent upward momentum in rates.
**Today’s Events**
ADP jobs (September): 90K versus 70K forecast, 38K previous
Core PCE (month-over-month, August): 0.2% versus 0.3% forecast, 0.2% previous
Core PCE (year-over-year, August): 3.0% versus 3.3% forecast, 3.3% previous
Core PCE Prices (quarter-over-quarter, Q2): 3.30% versus 3.6% forecast, 4.4% previous
Corporate profits (Q2): 7.7% versus 8.2% forecast, 0.5% previous
GDP (Q2): 2.2% versus 1.5% forecast, 2.1% previous
GDP Final Sales (Q2): 2.8% versus 2.2% forecast, 1.9% previous
PCE (year-over-year, August): 3.4% versus 3.7% forecast, 3.7% previous
PCE prices (month-over-month, August): 0.3% versus 0.4% forecast, 0.2% previous
**Bond Pricing**
**UMBS 30 yr**
| Coupon | Price | Intra-Day Change |
| 5.5 | 95.41 | -0.12 |
| 6.0 | 98.02 | -0.16 |
| 5.5 | 95.51 | -0.14 |
**GNMA 30 yr**
| Coupon | Price | Intra-Day Change |
**Treasuries**
| Term | Yield | Price | Intra-Day Yield Change |
| 2yr | 4.9 | 99.719 | 0.023 |
| 3yr | 5.001 | 98.275 | 0.031 |
| 5yr | 5.093 | 99.596 | 0.046 |
| 7yr | 5.188 | 98.906 | 0.049 |
| 10yr | 5.287 | 94.909 | 0.055 |
| 30yr | 5.632 | 92.698 | 0.067 |