**WTMS Blog Today = What’s up in Mortgage Today (PM) – 10/15/2026**
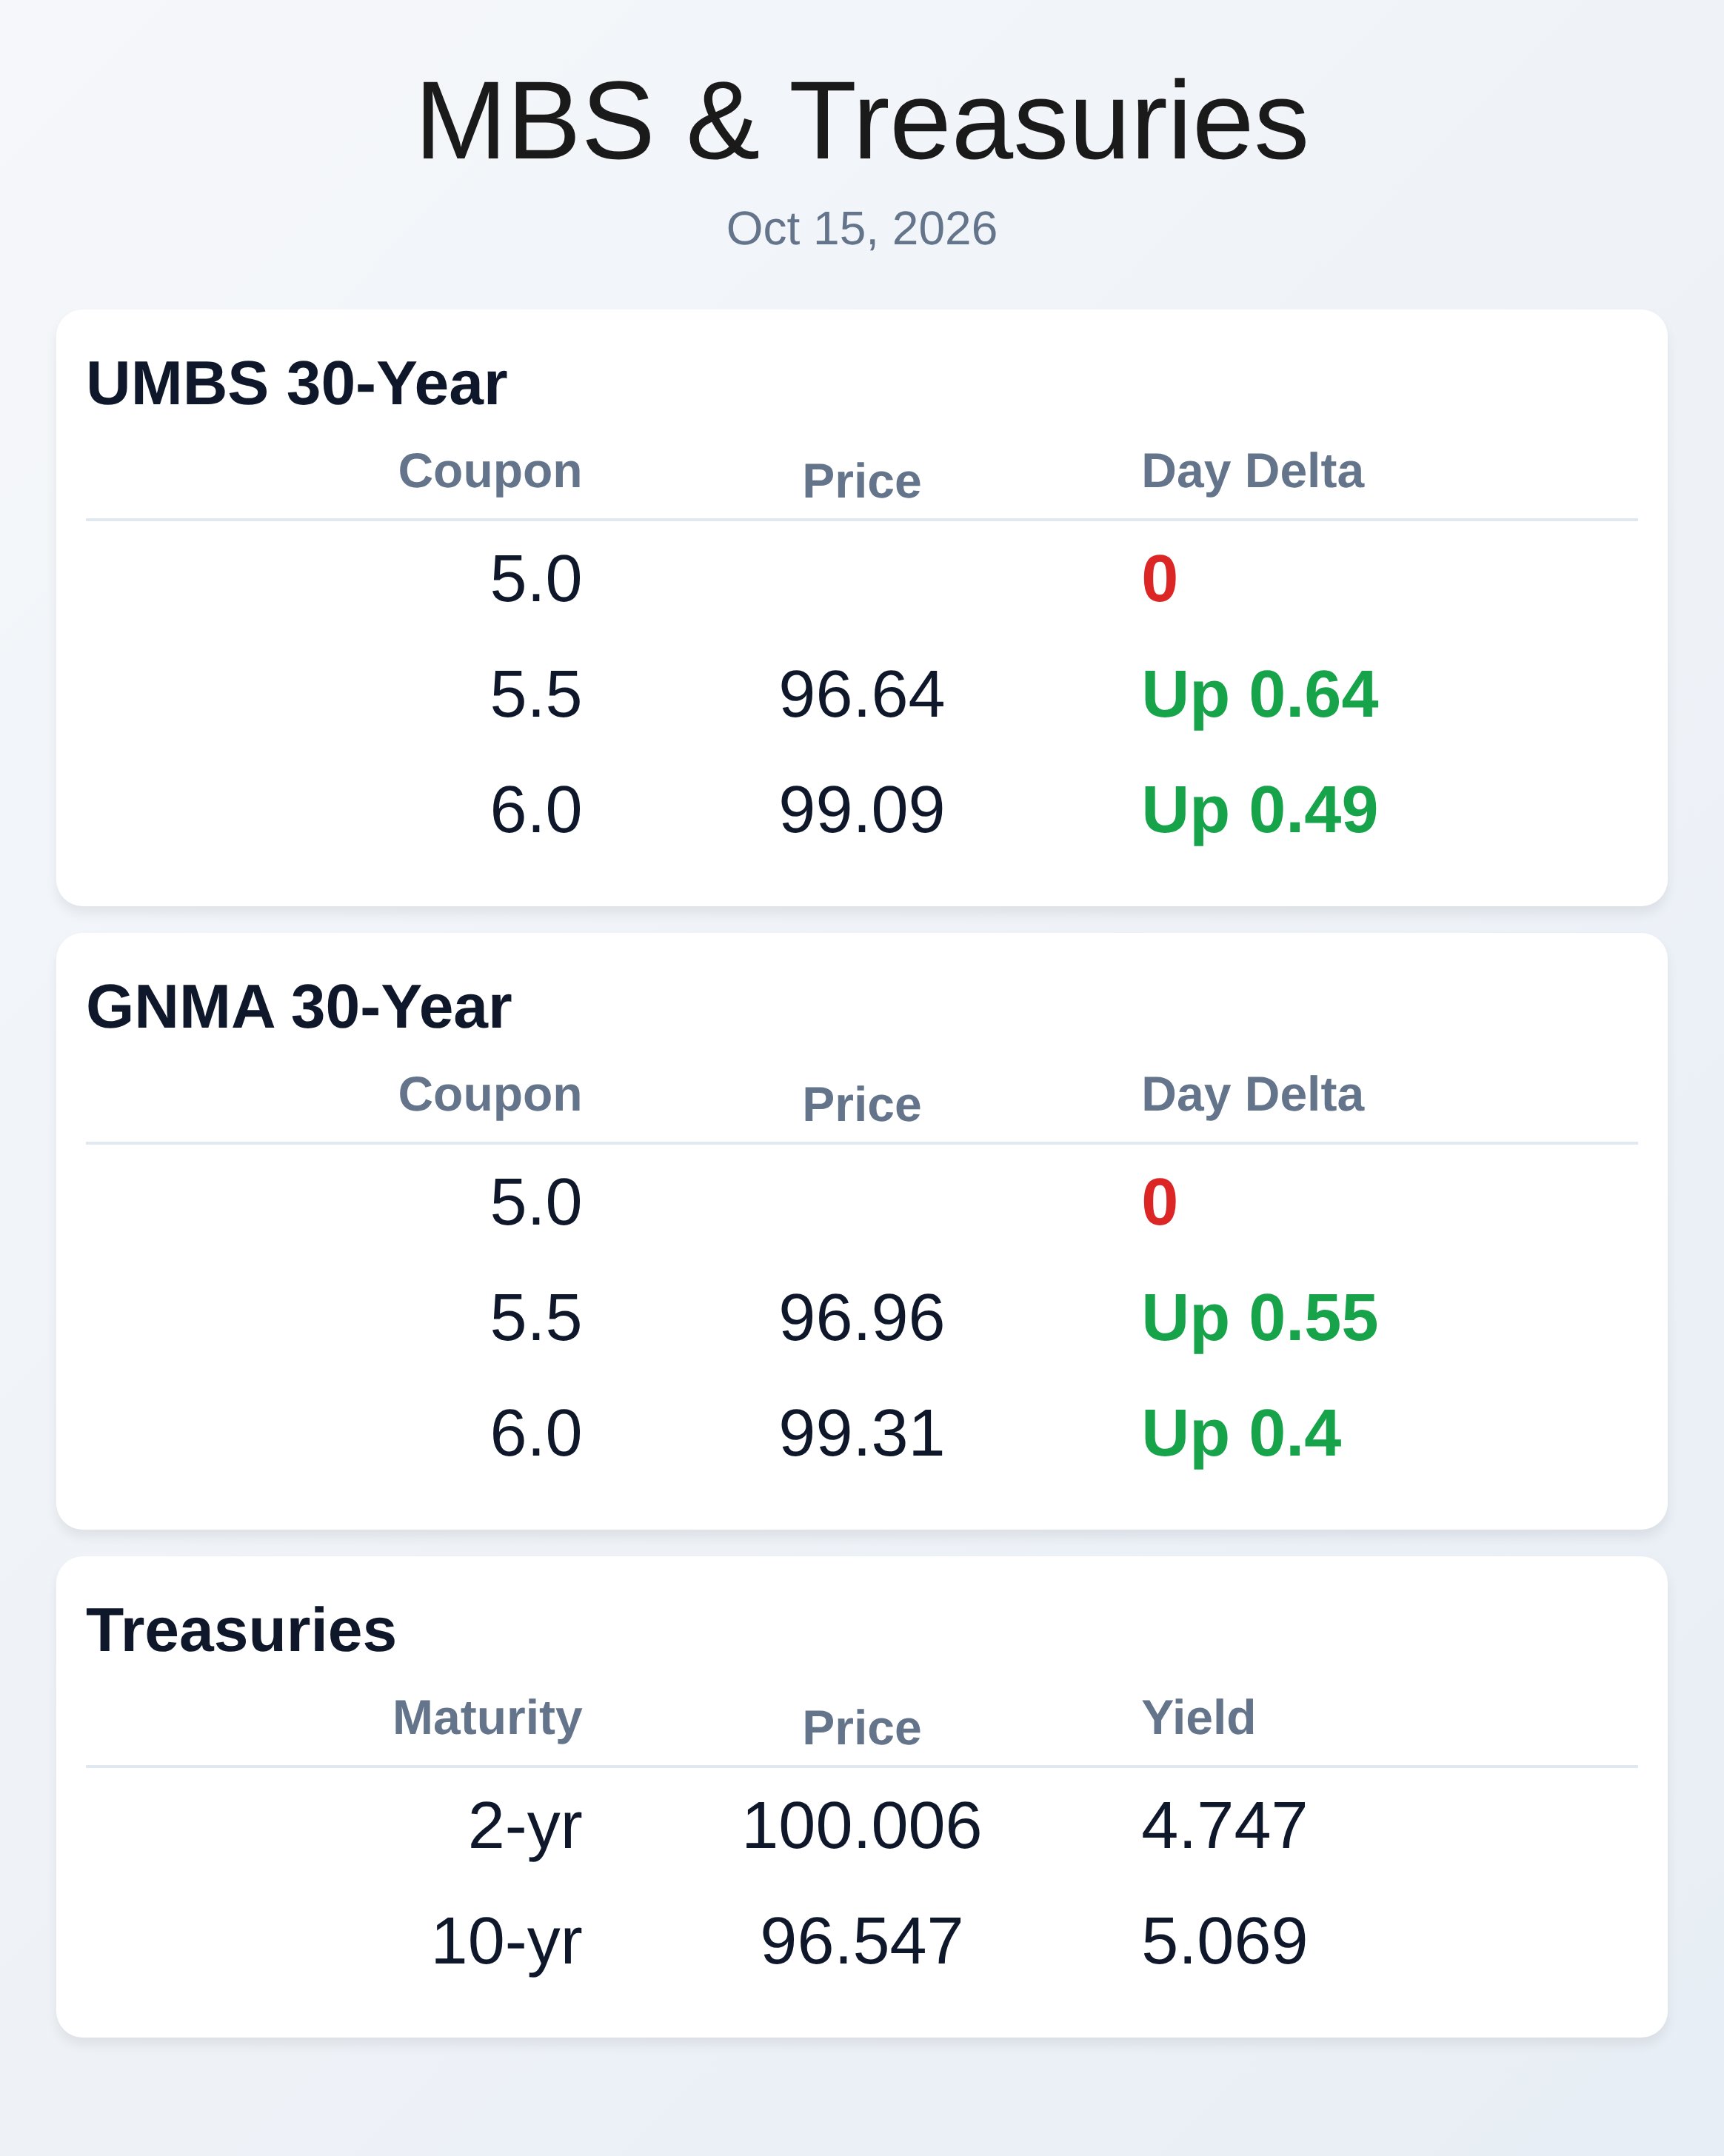
Rates delivered their biggest surprise this week after a punishing rally wiped out recent losses despite back-to-back hot inflation prints. The 10-year Treasury fell over 100 basis points from Wednesday morning highs, with UMBS 6.0 climbing nearly 0.70 points as investors rotated out of technology stocks and into bonds on AI credit concerns. A combination of bond-seller exhaustion at multi-decade yield highs and genuine fears about artificial intelligence company valuations overpowered inflation data that would have crushed bonds just days earlier.
While lenders who repriced early are facing negative adjustments, this rally represents phase one of what could be a broader rate correction or simply a tactical bounce. The real estate market continues deteriorating for borrowers. Home sellers outnumber buyers by 63 percent, the widest gap since records began in 2013, with buyer counts hitting record lows while inventory surged to levels not seen since March 2020.
Mortgage applications fell 2.7 percent week over week as rates hovered near 7.5 percent, their highest level in nearly three years, while adjustable-rate mortgages jumped to 10.5 percent of applications—the highest share in nearly a year. Purchase applications dropped 4 percent weekly and 16 percent annually as affordability pressures mount and available homes concentrate at the higher end of the market. The existing-home sales report showed modest 1.5 percent monthly growth but remained 2.2 percent below year-ago levels, signaling continued weakness in transaction volume.
MBA forecasts reveal the origination landscape is shrinking faster than industry leaders anticipated. Total single-family mortgage origination volume is now expected to decrease 5 percent to just under 2 trillion dollars in 2027 from 2.1 trillion expected in 2026, with purchase originations rising only 0.8 percent while refinance volumes plummet 17 percent. By loan count, total originations are forecast to decrease 5.6 percent to 5.0 million loans from 5.3 million this year, reflecting the persistent squeeze on both purchase and refinance channels.
These downward revisions underscore how elevated rates, limited affordability, and reduced borrower qualification capacity are reshaping the entire mortgage ecosystem for the coming year. Originators must prepare for significantly leaner margins and tighter cost structures to remain profitable in this constrained environment. Agency MBS faced greater challenges than Treasuries throughout the week as rate volatility, limited buyer demand, and widening spreads weighed on valuations and margins.
The FNCL current-coupon spread widened to 124 basis points over the 5-year/10-year Treasury blend, while 15-year securities outperformed as their spread tightened to 66 basis points. Mortgage rates climbed to 7.40 percent with primary-secondary spreads widening to 92 basis points, reflecting the pressure on loan sellers and risk management. Friday’s rally provided some relief, but the damage from earlier in the week demonstrates how quickly spreads can deteriorate when rate volatility spikes and liquidity providers pull back.
Portfolio managers must closely monitor servicer-level prepayment differences and borrower behavior variation to identify true value in mortgage pools. Credit expansion through alternative scoring models and enhanced occupancy verification are reshaping underwriting and quality control. Fannie Mae’s November 13 update will use additional borrower history, financial profile, and property data to flag occupancy designations before loan delivery, requiring lenders to clarify borrower plans and resubmit files as investment property if primary occupancy cannot be confirmed.
VantageScore 4.0’s expanded adoption across Fannie and Freddie represents significant credit access expansion, with sub-700 FICO loans now representing 11.4 percent of 2026 UMBS 30-year issuance—the highest share since 2023. While digital validation tools can eliminate repeat verification, lenders must ensure underwriting discipline remains strong as alternative scores potentially favor more favorable borrower results. The industry’s simultaneous focus on affordability improvements and defect reduction signals a delicate balance between expanding credit and protecting investor interests.
Technology adoption accelerated across the mortgage pipeline as AI-driven automation moves from pilot projects to enterprise deployment. loanDepot extended Novaprime beyond government insuring tasks into CD reconciliation, defect remediation, and loan delivery to reduce cost per loan while maintaining quality through real-time measurement and complete audit trails. nCino launched an LO AI suite targeting preapproval bottlenecks with six integrated capabilities designed to work alongside existing systems, while MortgageFlex’s LoanQuest now supports UAD 3.6 appraisal workflows and updated UCDP submission processing.
Polly partnered with F9 Advisors to bring capital markets execution and advisory into lenders’ own platforms without moving data or pricing, allowing flexible scaling of hedging and loan sales operations. For originators, the message is clear: automation is no longer optional, but careful change management and adoption strategy remain critical to converting technological capability into actual business outcomes.
**Locking vs Floating**
Bond market direction remains uncertain despite the strongest five-day rally in recent memory.
While AI stock corrections and bond-seller exhaustion at decade-high yields provided powerful support this week, a sustained economic slowdown or war resolution would be needed to justify a bigger rally beyond this initial move. Lenders should recognize this could be either act one of a meaningful correction or a short story ending here, making selective positioning more prudent than aggressive repositioning.
**Today’s Events**
Core PPI month over month: 0.7% vs 0.3% forecast, 0.2% prior
Core PPI year over year: 5.0% vs 4.4% forecast, 4.6% prior
PPI month over month: 1.3% vs 0.5% forecast, 0.4% prior
PPI year over year: 6.3% vs 5.3% forecast, 5.4% prior
Retail Sales: 0.8% vs 0.3% forecast, 1.2% prior
Retail Sales Control Group: 0.1% vs 0.3% forecast, 1.4% prior
Existing Home Sales: 3.99M vs 3.95M forecast, 3.93M prior
**Bond Pricing**
**UMBS 30 yr**
| Coupon | Price | Intra-Day Change |
**GNMA 30 yr**
| Coupon | Price | Intra-Day Change |
**Treasuries**
| Term | Yield | Price | Intra-Day Yield Change |